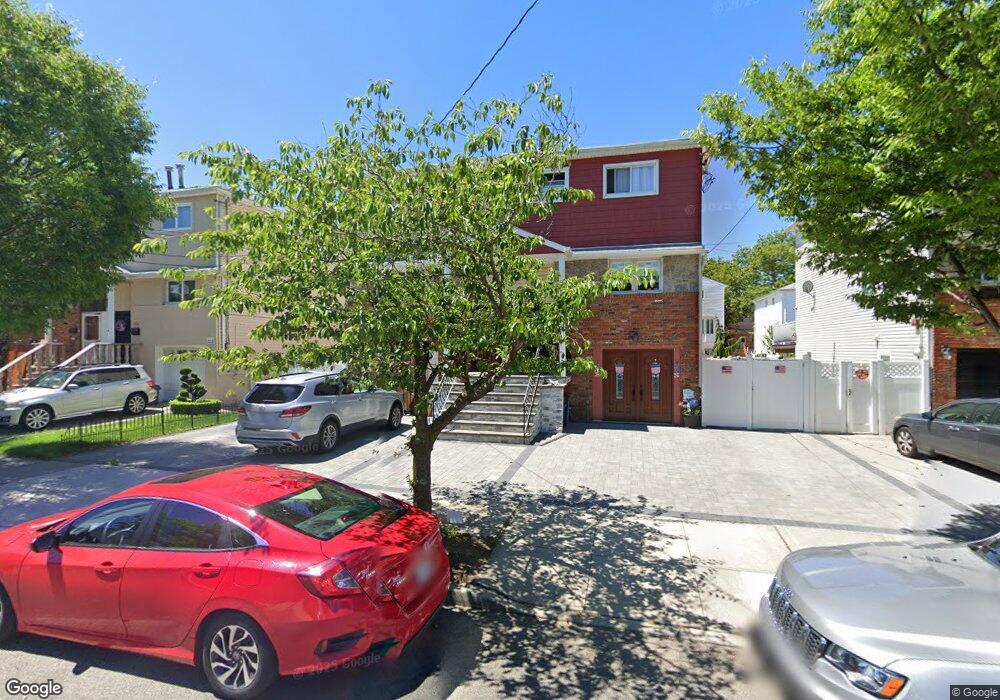
2336 E 71st St Brooklyn, NY 11234
Bergen Beach NeighborhoodEstimated Value: $842,393 - $1,060,000
Studio
--
Bath
1,665
Sq Ft
$556/Sq Ft
Est. Value
About This Home
This home is located at 2336 E 71st St, Brooklyn, NY 11234 and is currently estimated at $926,098, approximately $556 per square foot. 2336 E 71st St is a home located in Kings County with nearby schools including P.S. 312 Bergen Beach, James Madison High School, and Success Academy Charter School - Bergen Beach.
Ownership History
Date
Name
Owned For
Owner Type
Purchase Details
Closed on
Sep 20, 2007
Sold by
Basile Andrew M
Bought by
Basile Andrew M
Current Estimated Value
Purchase Details
Closed on
Mar 23, 1995
Sold by
Dimassimo David
Bought by
Basile Andrew M and Martino Deborah
Home Financials for this Owner
Home Financials are based on the most recent Mortgage that was taken out on this home.
Original Mortgage
$135,000
Interest Rate
8.66%
Create a Home Valuation Report for This Property
The Home Valuation Report is an in-depth analysis detailing your home's value as well as a comparison with similar homes in the area
Home Values in the Area
Average Home Value in this Area
Purchase History
| Date | Buyer | Sale Price | Title Company |
|---|---|---|---|
| Basile Andrew M | -- | -- | |
| Basile Andrew M | $260,500 | Commonwealth Land Title Ins |
Source: Public Records
Mortgage History
| Date | Status | Borrower | Loan Amount |
|---|---|---|---|
| Closed | Basile Andrew M | $135,000 |
Source: Public Records
Tax History
| Year | Tax Paid | Tax Assessment Tax Assessment Total Assessment is a certain percentage of the fair market value that is determined by local assessors to be the total taxable value of land and additions on the property. | Land | Improvement |
|---|---|---|---|---|
| 2025 | $8,167 | $49,500 | $12,360 | $37,140 |
| 2024 | $8,167 | $42,060 | $12,360 | $29,700 |
| 2023 | $8,353 | $51,180 | $12,360 | $38,820 |
| 2022 | $7,723 | $49,800 | $12,360 | $37,440 |
| 2021 | $7,670 | $49,920 | $12,360 | $37,560 |
| 2020 | $3,588 | $46,920 | $12,360 | $34,560 |
| 2019 | $7,178 | $42,660 | $12,360 | $30,300 |
| 2018 | $6,927 | $35,443 | $9,325 | $26,118 |
| 2017 | $6,516 | $33,437 | $9,448 | $23,989 |
| 2016 | $5,996 | $31,545 | $9,699 | $21,846 |
| 2015 | $4,148 | $29,760 | $13,740 | $16,020 |
| 2014 | $4,148 | $29,760 | $13,740 | $16,020 |
Source: Public Records
Map
Nearby Homes
- 7311 Avenue W
- 2427 E 72nd St
- 2239 E 70th St
- 2248 E 70th St
- 2246 E 70th St
- 2447 E 71st St
- 7417 Avenue W
- 2221 E 69th St
- 2456 E 70th St
- 2404 Royce St
- 2346 Bergen Ave
- 2310 Bergen Ave
- 2172 E 72nd St
- 80 Whitman Dr
- 2134 E 74th St Unit 2138
- 255 Mayfair Dr N
- 2345 E 65th St
- 2416 E 66th St
- 2363 E 64th St
- 2063 E 71st St
Your Personal Tour Guide
Ask me questions while you tour the home.