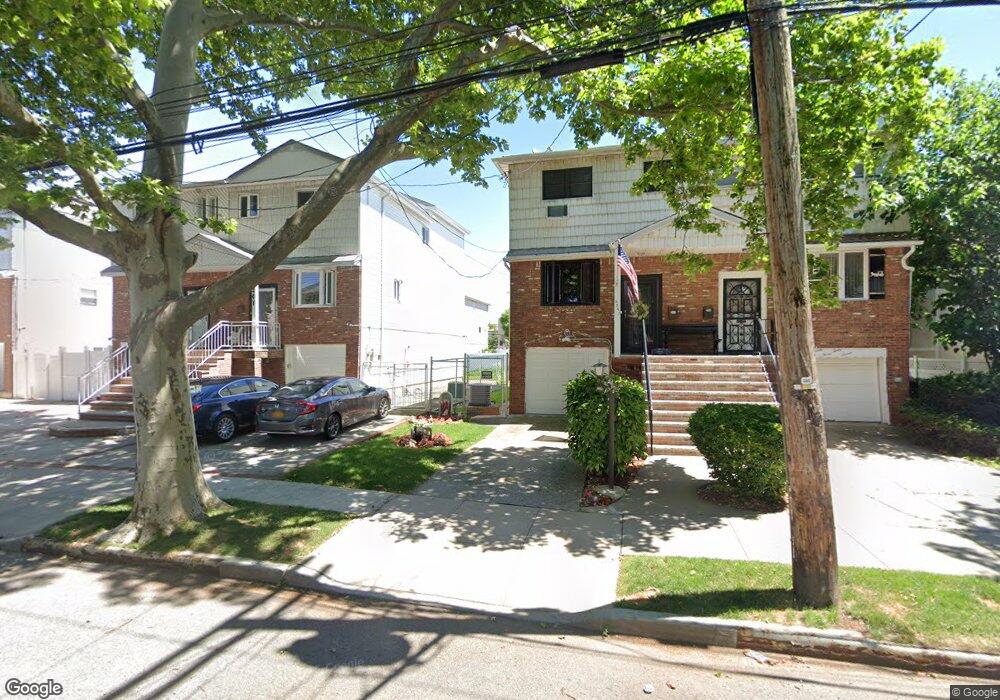
2345 E 70th St Brooklyn, NY 11234
Bergen Beach NeighborhoodEstimated Value: $879,893 - $972,000
3
Beds
3
Baths
1,887
Sq Ft
$492/Sq Ft
Est. Value
About This Home
This home is located at 2345 E 70th St, Brooklyn, NY 11234 and is currently estimated at $927,973, approximately $491 per square foot. 2345 E 70th St is a home located in Kings County with nearby schools including P.S. 312 Bergen Beach, James Madison High School, and Success Academy Charter School - Bergen Beach.
Ownership History
Date
Name
Owned For
Owner Type
Purchase Details
Closed on
Jun 13, 2007
Sold by
Romano Marie A
Bought by
Cosenza Arlene and Cosenza Joseph
Current Estimated Value
Home Financials for this Owner
Home Financials are based on the most recent Mortgage that was taken out on this home.
Original Mortgage
$32,700
Outstanding Balance
$19,966
Interest Rate
6.24%
Estimated Equity
$908,007
Create a Home Valuation Report for This Property
The Home Valuation Report is an in-depth analysis detailing your home's value as well as a comparison with similar homes in the area
Home Values in the Area
Average Home Value in this Area
Purchase History
| Date | Buyer | Sale Price | Title Company |
|---|---|---|---|
| Cosenza Arlene | $585,000 | -- | |
| Cosenza Arlene | $585,000 | -- |
Source: Public Records
Mortgage History
| Date | Status | Borrower | Loan Amount |
|---|---|---|---|
| Open | Cosenza Arlene | $32,700 | |
| Closed | Cosenza Arlene | $32,700 | |
| Open | Cosenza Arlene | $468,000 | |
| Closed | Cosenza Arlene | $468,000 |
Source: Public Records
Tax History
| Year | Tax Paid | Tax Assessment Tax Assessment Total Assessment is a certain percentage of the fair market value that is determined by local assessors to be the total taxable value of land and additions on the property. | Land | Improvement |
|---|---|---|---|---|
| 2025 | $8,986 | $53,460 | $13,740 | $39,720 |
| 2024 | $8,986 | $51,420 | $13,740 | $37,680 |
| 2023 | $9,015 | $55,080 | $13,740 | $41,340 |
| 2022 | $8,337 | $52,980 | $13,740 | $39,240 |
| 2021 | $8,281 | $50,820 | $13,740 | $37,080 |
| 2020 | $3,874 | $42,480 | $13,740 | $28,740 |
| 2019 | $7,750 | $46,980 | $13,740 | $33,240 |
| 2018 | $7,481 | $38,158 | $11,089 | $27,069 |
| 2017 | $7,039 | $35,999 | $11,497 | $24,502 |
| 2016 | $6,479 | $33,962 | $11,488 | $22,474 |
| 2015 | $4,370 | $32,040 | $15,240 | $16,800 |
| 2014 | $4,370 | $32,040 | $15,240 | $16,800 |
Source: Public Records
Map
Nearby Homes
- 2248 E 70th St
- 2246 E 70th St
- 2239 E 70th St
- 2427 E 72nd St
- 2447 E 71st St
- 2233 E 72nd St
- 7417 Avenue W
- 2172 E 72nd St
- 2346 Bergen Ave
- 2310 Bergen Ave
- 255 Mayfair Dr N
- 2345 E 65th St
- 2136 E 69th St
- 2321 E 64th St
- 2115 E 70th St
- 2357 E 64th St
- 2363 E 64th St
- 2134 E 74th St Unit 2138
- 2150 Royce St
- 2434 E 66th St
Your Personal Tour Guide
Ask me questions while you tour the home.