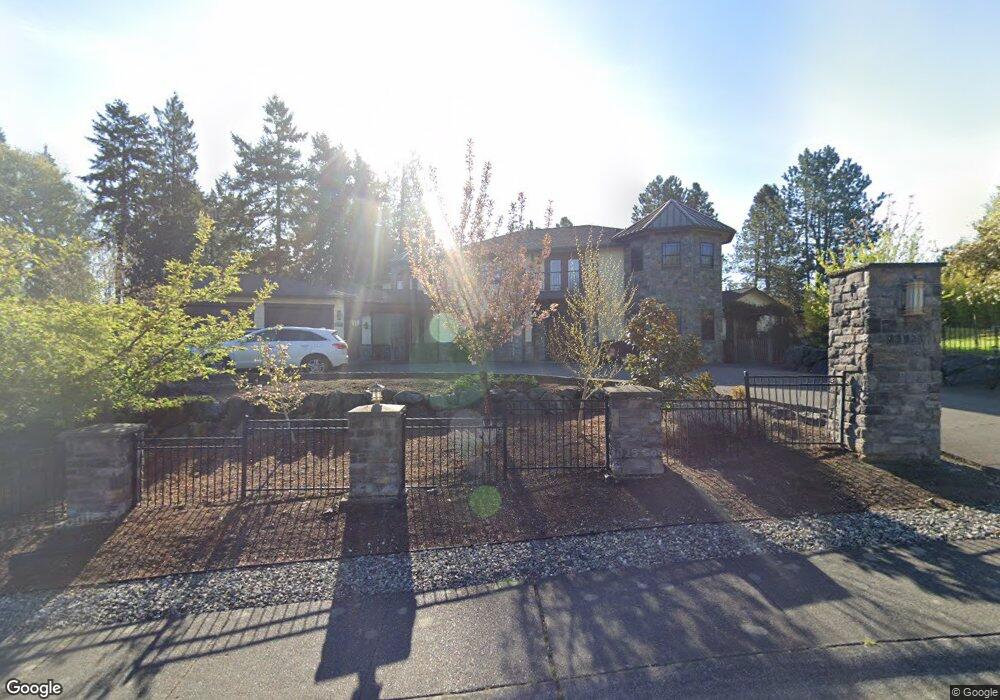
23921 25th Dr SE Bothell, WA 98021
Canyon Park NeighborhoodEstimated Value: $2,323,000 - $3,621,000
5
Beds
7
Baths
6,985
Sq Ft
$434/Sq Ft
Est. Value
About This Home
This home is located at 23921 25th Dr SE, Bothell, WA 98021 and is currently estimated at $3,034,232, approximately $434 per square foot. 23921 25th Dr SE is a home with nearby schools including Maywood Hills Elementary School, Canyon Park Junior High School, and Bothell High School.
Ownership History
Date
Name
Owned For
Owner Type
Purchase Details
Closed on
Nov 28, 2016
Sold by
Cheng Su Ching
Bought by
Cheng Ching Jen
Current Estimated Value
Purchase Details
Closed on
Apr 22, 2013
Sold by
Tmc Equity Investment Llc
Bought by
Cheng Ching Jen
Purchase Details
Closed on
May 27, 2008
Sold by
Lee Darrell Jesse
Bought by
Tmc Investment Llc
Home Financials for this Owner
Home Financials are based on the most recent Mortgage that was taken out on this home.
Original Mortgage
$378,000
Interest Rate
5.87%
Mortgage Type
Purchase Money Mortgage
Purchase Details
Closed on
May 3, 2005
Sold by
Lee Atha C
Bought by
Gibson Clay E and Gibson Leah Jeannette
Home Financials for this Owner
Home Financials are based on the most recent Mortgage that was taken out on this home.
Original Mortgage
$100,000
Interest Rate
5.99%
Mortgage Type
Fannie Mae Freddie Mac
Purchase Details
Closed on
Jul 16, 1997
Sold by
Lee Nelson T and Lee Atha C
Bought by
Lee Nelson T and Lee Atha C
Create a Home Valuation Report for This Property
The Home Valuation Report is an in-depth analysis detailing your home's value as well as a comparison with similar homes in the area
Home Values in the Area
Average Home Value in this Area
Purchase History
| Date | Buyer | Sale Price | Title Company |
|---|---|---|---|
| Cheng Ching Jen | $127,500 | Chicago Title Company Of Wa | |
| Cheng Ching Jen | -- | None Available | |
| Tmc Investment Llc | $540,000 | Ticor Title | |
| Gibson Clay E | $11,235 | Pnwt | |
| Lee Nelson T | -- | -- |
Source: Public Records
Mortgage History
| Date | Status | Borrower | Loan Amount |
|---|---|---|---|
| Previous Owner | Tmc Investment Llc | $378,000 | |
| Previous Owner | Gibson Clay E | $100,000 |
Source: Public Records
Tax History
| Year | Tax Paid | Tax Assessment Tax Assessment Total Assessment is a certain percentage of the fair market value that is determined by local assessors to be the total taxable value of land and additions on the property. | Land | Improvement |
|---|---|---|---|---|
| 2026 | $22,746 | $2,904,100 | $750,000 | $2,154,100 |
| 2025 | $20,635 | $2,778,900 | $710,000 | $2,068,900 |
| 2024 | $20,635 | $2,511,800 | $610,000 | $1,901,800 |
| 2023 | $20,705 | $2,749,700 | $850,000 | $1,899,700 |
| 2022 | $20,664 | $2,217,800 | $600,000 | $1,617,800 |
| 2020 | $18,031 | $1,793,100 | $469,000 | $1,324,100 |
| 2019 | $15,642 | $1,613,600 | $375,000 | $1,238,600 |
| 2018 | $14,502 | $1,442,700 | $330,000 | $1,112,700 |
| 2017 | $13,960 | $1,410,200 | $280,000 | $1,130,200 |
| 2016 | $13,020 | $1,359,300 | $255,000 | $1,104,300 |
| 2015 | $11,842 | $1,168,700 | $240,000 | $928,700 |
| 2013 | $4,015 | $340,800 | $161,000 | $179,800 |
Source: Public Records
Map
Nearby Homes
- 2403 238th Place SE
- 1 XXX 240th St SE
- 3520 237th St SE Unit 45
- 23502 25th Dr SE
- 3515 237th St SE Unit 28
- 23210 27th Ave SE Unit 1
- 0 239th St SE
- 23328 19th Dr SE
- 1725 242nd St SE Unit 238
- 23825 15th Ave SE Unit 93
- 23825 15th Ave SE Unit 311
- 23825 15th Ave SE Unit 186
- 23825 15th Ave SE Unit 101
- 23825 15th Ave SE Unit 159
- 20008 101st Place NE
- 1611 242nd St SE
- 3508 237th St SE Unit 47
- 23736 35th Dr SE
- 23736 35th Dr SE Unit 42
- 3509 237th St SE Unit 27
- 24001 26th Dr SE
- 23911 25th Dr SE
- 1 X 240th St SE
- 24002 26th Dr SE
- 24009 26th Dr SE
- 23907 25th Dr SE
- 23918 25th Dr SE
- 23926 25th Dr SE
- 2524 240th St SE
- 24004 26th Dr SE
- 23910 25th Dr SE
- 24017 26th Dr SE
- 24013 26th Dr SE
- 23903 25th Dr SE
- 2507 240th St SE
- 24010 26th Dr SE
- 2522 240th St SE
- 2504 240th St SE
- 24022 26th Dr SE
- 23830 25th Dr SE
Your Personal Tour Guide
Ask me questions while you tour the home.