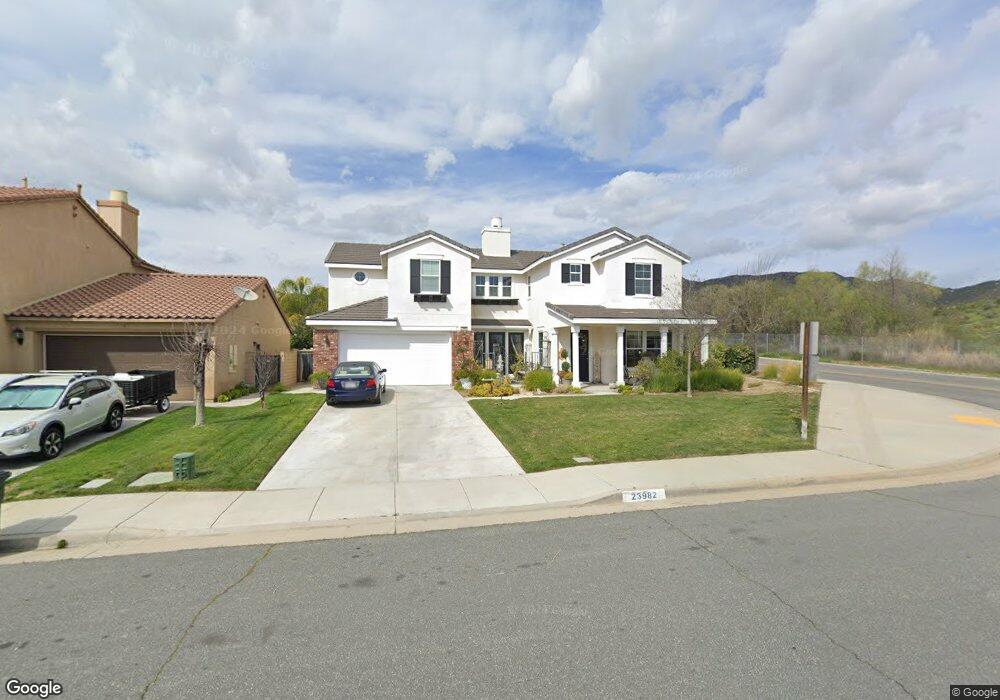
23982 Doheny Cir Wildomar, CA 92595
Estimated Value: $716,139 - $769,000
5
Beds
5
Baths
3,352
Sq Ft
$219/Sq Ft
Est. Value
About This Home
This home is located at 23982 Doheny Cir, Wildomar, CA 92595 and is currently estimated at $735,035, approximately $219 per square foot. 23982 Doheny Cir is a home located in Riverside County with nearby schools including Ronald Reagan Elementary School, David A. Brown Middle School, and Elsinore High School.
Ownership History
Date
Name
Owned For
Owner Type
Purchase Details
Closed on
Dec 22, 2017
Sold by
Surdo Paul A and Williams Mariec
Bought by
Surdo Paul A and Williams Marie A
Current Estimated Value
Home Financials for this Owner
Home Financials are based on the most recent Mortgage that was taken out on this home.
Original Mortgage
$339,000
Outstanding Balance
$285,482
Interest Rate
3.95%
Mortgage Type
New Conventional
Estimated Equity
$449,553
Purchase Details
Closed on
May 23, 2008
Sold by
Carmel Oakmont 222 Llc
Bought by
Surdo Paul A and Williams Marie
Home Financials for this Owner
Home Financials are based on the most recent Mortgage that was taken out on this home.
Original Mortgage
$336,523
Interest Rate
6%
Mortgage Type
FHA
Purchase Details
Closed on
Sep 19, 2006
Sold by
Adams Edward
Bought by
Bujan Carl J
Home Financials for this Owner
Home Financials are based on the most recent Mortgage that was taken out on this home.
Original Mortgage
$559,200
Interest Rate
7.73%
Mortgage Type
Negative Amortization
Create a Home Valuation Report for This Property
The Home Valuation Report is an in-depth analysis detailing your home's value as well as a comparison with similar homes in the area
Home Values in the Area
Average Home Value in this Area
Purchase History
| Date | Buyer | Sale Price | Title Company |
|---|---|---|---|
| Surdo Paul A | -- | Chicago Title Company | |
| Surdo Paul A | $350,000 | Fidelity National Title | |
| Bujan Carl J | $699,000 | New Century Title Company |
Source: Public Records
Mortgage History
| Date | Status | Borrower | Loan Amount |
|---|---|---|---|
| Open | Surdo Paul A | $339,000 | |
| Closed | Surdo Paul A | $336,523 | |
| Previous Owner | Bujan Carl J | $559,200 |
Source: Public Records
Tax History
| Year | Tax Paid | Tax Assessment Tax Assessment Total Assessment is a certain percentage of the fair market value that is determined by local assessors to be the total taxable value of land and additions on the property. | Land | Improvement |
|---|---|---|---|---|
| 2025 | $7,677 | $459,699 | $91,937 | $367,762 |
| 2023 | $7,677 | $441,850 | $88,368 | $353,482 |
| 2022 | $7,527 | $433,187 | $86,636 | $346,551 |
| 2021 | $7,439 | $424,694 | $84,938 | $339,756 |
| 2020 | $7,393 | $420,341 | $84,068 | $336,273 |
| 2019 | $7,306 | $412,100 | $82,420 | $329,680 |
| 2018 | $7,219 | $404,020 | $80,804 | $323,216 |
| 2017 | $7,135 | $396,099 | $79,220 | $316,879 |
| 2016 | $6,996 | $388,333 | $77,667 | $310,666 |
| 2015 | $6,973 | $382,501 | $76,501 | $306,000 |
| 2014 | $6,845 | $375,010 | $75,003 | $300,007 |
Source: Public Records
Map
Nearby Homes
- 24038 Montecito Dr
- 24383 Topacio Ct
- 35681 Salida Del Sol
- 23272 Alta Oaks Dr
- 23407 Crystal Way
- 35484 Country Park Dr
- 35790 Crest Meadow Dr
- 23347 Crystal Way
- 23045 Twinflower Ave
- 23025 Twinflower Ave
- 22890 Timber Ln
- 22956 Akwo Cir
- 36351 Elizabeth Ln
- 36351 Elizabeth Ln Unit 25108
- 36351 Elizabeth Ln Unit 33107
- 35465 Woshka Ln
- 25018 Crimson Lasso Dr
- 22981 Nan St
- 22997 Sweetbay Cir
- 23069 Sweetbay Cir
- 23970 Doheny Cir
- 23958 Doheny Cir
- 35590 Bovard St
- 23946 Doheny Cir
- 35602 Bovard St
- 23951 Doheny Cir
- 23934 Doheny Cir
- 24026 Montecito Dr
- 35597 Capistrano St
- 23939 Doheny Cir
- 23922 Doheny Cir
- 35609 Capistrano St
- 35607 Bovard St
- 3648 Poplar Crest Rd
- 23927 Doheny Cir
- 24050 Montecito Dr
- 35626 Bovard St
- 35621 Capistrano St
- 35619 Bovard St
- 23910 Doheny Cir
Your Personal Tour Guide
Ask me questions while you tour the home.