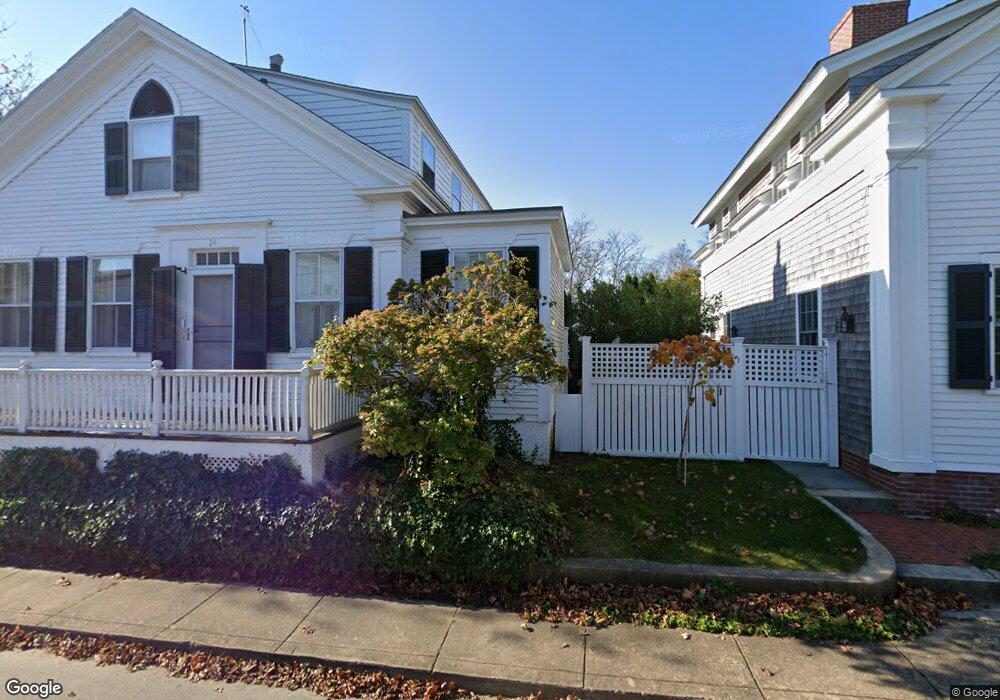
24 Morse St Edgartown, MA 02539
Edgartown NeighborhoodEstimated Value: $2,803,000 - $4,249,000
3
Beds
3
Baths
1,971
Sq Ft
$1,820/Sq Ft
Est. Value
About This Home
This home is located at 24 Morse St, Edgartown, MA 02539 and is currently estimated at $3,586,754, approximately $1,819 per square foot. 24 Morse St is a home located in Dukes County with nearby schools including Edgartown Elementary School and Martha's Vineyard Regional High School.
Ownership History
Date
Name
Owned For
Owner Type
Purchase Details
Closed on
Apr 12, 2012
Sold by
Qprt James S Kehler and Mahoney Eloise K
Bought by
Farnham Katherine S and Mahoney Eloise K
Current Estimated Value
Purchase Details
Closed on
Aug 8, 2008
Sold by
Kehler Joan O and Mahoney Eloise K
Bought by
Mahoney Eloise K and Farnham Katherine S
Create a Home Valuation Report for This Property
The Home Valuation Report is an in-depth analysis detailing your home's value as well as a comparison with similar homes in the area
Home Values in the Area
Average Home Value in this Area
Purchase History
| Date | Buyer | Sale Price | Title Company |
|---|---|---|---|
| Farnham Katherine S | -- | -- | |
| Mahoney Eloise K | -- | -- |
Source: Public Records
Mortgage History
| Date | Status | Borrower | Loan Amount |
|---|---|---|---|
| Open | Farnham Katherine S | $40,000 |
Source: Public Records
Tax History
| Year | Tax Paid | Tax Assessment Tax Assessment Total Assessment is a certain percentage of the fair market value that is determined by local assessors to be the total taxable value of land and additions on the property. | Land | Improvement |
|---|---|---|---|---|
| 2025 | $7,742 | $2,921,500 | $1,552,900 | $1,368,600 |
| 2024 | $6,930 | $2,717,600 | $1,552,900 | $1,164,700 |
| 2023 | $7,010 | $2,781,900 | $1,577,500 | $1,204,400 |
| 2022 | $8,685 | $2,866,300 | $1,688,400 | $1,177,900 |
| 2021 | $7,874 | $2,400,600 | $1,411,700 | $988,900 |
| 2020 | $7,418 | $2,214,300 | $1,344,500 | $869,800 |
| 2019 | $8,825 | $2,280,400 | $1,344,500 | $935,900 |
| 2018 | $7,824 | $2,021,600 | $1,226,800 | $794,800 |
| 2017 | $7,109 | $2,002,400 | $1,226,800 | $775,600 |
| 2016 | $7,434 | $2,053,500 | $1,226,800 | $826,700 |
| 2015 | $7,076 | $2,039,200 | $1,161,400 | $877,800 |
Source: Public Records
Map
Nearby Homes
- 68 N Water St
- 114 N Water St
- 117 N Water St
- 14 Thayer St
- 10 Peases Point Way N
- 52 S Summer St
- 44 Plantingfield Way Unit 2
- 44 Plantingfield Way
- 69 School St
- 43 Peases Point Way S
- 99 Cooke St
- 32 Norton Orchard Rd
- 23 Pinehurst Rd
- 218 Upper Main St
- 15 Chapman Ln Unit 111.1
- 38 Pinehurst Rd
- 17 Chapman Ln
- 17 Chapman La
- 5 Louis Field Rd Unit 121.3
- 5 Louis Field Rd
Your Personal Tour Guide
Ask me questions while you tour the home.