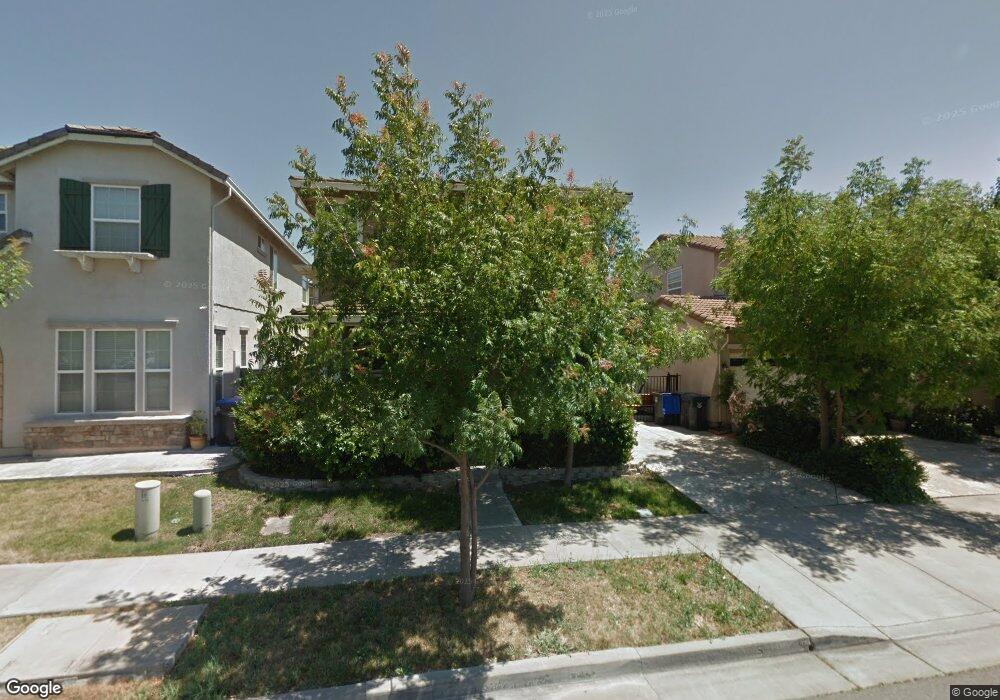
2411 Digerud Dr Fairfield, CA 94533
Estimated Value: $584,240 - $633,000
3
Beds
3
Baths
1,999
Sq Ft
$301/Sq Ft
Est. Value
About This Home
This home is located at 2411 Digerud Dr, Fairfield, CA 94533 and is currently estimated at $602,310, approximately $301 per square foot. 2411 Digerud Dr is a home located in Solano County with nearby schools including Center Elementary School, Golden West Middle School, and Vanden High School.
Ownership History
Date
Name
Owned For
Owner Type
Purchase Details
Closed on
Nov 28, 2012
Sold by
Iqbal Waseem G and Ghafoor Rashid S
Bought by
Clark Kevin and Manrique Tatiana Aida
Current Estimated Value
Home Financials for this Owner
Home Financials are based on the most recent Mortgage that was taken out on this home.
Original Mortgage
$220,825
Outstanding Balance
$152,128
Interest Rate
3.25%
Mortgage Type
FHA
Estimated Equity
$450,182
Purchase Details
Closed on
Jan 10, 2005
Sold by
Tim Lewis Communities
Bought by
Iqbal Waseem G and Ghafoor Rashid S
Home Financials for this Owner
Home Financials are based on the most recent Mortgage that was taken out on this home.
Original Mortgage
$336,360
Interest Rate
5.8%
Mortgage Type
Purchase Money Mortgage
Create a Home Valuation Report for This Property
The Home Valuation Report is an in-depth analysis detailing your home's value as well as a comparison with similar homes in the area
Home Values in the Area
Average Home Value in this Area
Purchase History
| Date | Buyer | Sale Price | Title Company |
|---|---|---|---|
| Clark Kevin | $225,000 | First American Title Company | |
| Iqbal Waseem G | $420,500 | First American Title Co |
Source: Public Records
Mortgage History
| Date | Status | Borrower | Loan Amount |
|---|---|---|---|
| Open | Clark Kevin | $220,825 | |
| Previous Owner | Iqbal Waseem G | $336,360 | |
| Closed | Iqbal Waseem G | $84,090 |
Source: Public Records
Tax History
| Year | Tax Paid | Tax Assessment Tax Assessment Total Assessment is a certain percentage of the fair market value that is determined by local assessors to be the total taxable value of land and additions on the property. | Land | Improvement |
|---|---|---|---|---|
| 2025 | $4,781 | $276,936 | $92,351 | $184,585 |
| 2024 | $4,781 | $271,507 | $90,541 | $180,966 |
| 2023 | $4,743 | $266,184 | $88,766 | $177,418 |
| 2022 | $4,443 | $260,966 | $87,026 | $173,940 |
| 2021 | $4,379 | $255,850 | $85,320 | $170,530 |
| 2020 | $4,318 | $253,228 | $84,446 | $168,782 |
| 2019 | $4,244 | $248,264 | $82,791 | $165,473 |
| 2018 | $4,186 | $243,397 | $81,168 | $162,229 |
| 2017 | $4,075 | $238,626 | $79,577 | $159,049 |
| 2016 | $4,016 | $233,948 | $78,017 | $155,931 |
| 2015 | $3,956 | $230,435 | $76,846 | $153,589 |
| 2014 | $3,887 | $225,922 | $75,341 | $150,581 |
Source: Public Records
Map
Nearby Homes
- 2428 Hanson Dr
- 2438 Sheldon Dr
- 2382 Sheldon Dr
- 2350 Sheldon Dr
- 2541 Rowe Dr
- 5025 Ellis Godfrey Dr
- 5161 Freitas Way
- 5138 Rowe Dr
- 2738 Blakely Ln
- 2319 Hancock Dr
- 5291 Finkas Ln
- 5311 Gramercy Cir
- 2433 Sanders Ln
- 5282 Jacque Bell Ln
- 2746 Gracie Place
- 2481 Hancock Dr
- 2404 Indigo Dr
- 2426 Lake Club Dr
- 2429 Artisan Way
- 2432 Artisan Way
- 2407 Digerud Dr
- 2415 Digerud Dr
- 2410 White Dr
- 2403 Digerud Dr
- 2419 Digerud Dr
- 2414 White Dr
- 2406 White Dr
- 2402 White Dr
- 2418 White Dr
- 2399 Digerud Dr
- 2423 Digerud Dr
- 2414 Digerud Dr
- 2410 Digerud Dr
- 2422 White Dr
- 2395 Digerud Dr
- 2418 Digerud Dr
- 2406 Digerud Dr
- 2394 White Dr
- 2427 Digerud Dr
- 2413 White Dr
Your Personal Tour Guide
Ask me questions while you tour the home.