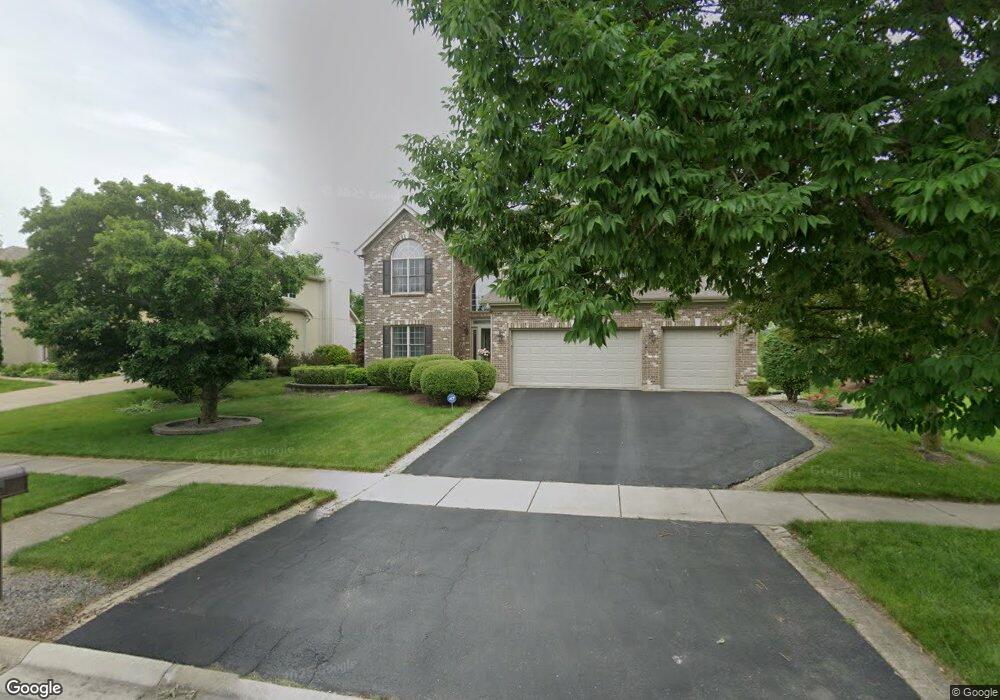
2412 Cloverdale Rd Unit 1 Naperville, IL 60564
Crestview Knoll NeighborhoodEstimated Value: $771,000 - $841,883
4
Beds
3
Baths
3,156
Sq Ft
$257/Sq Ft
Est. Value
About This Home
This home is located at 2412 Cloverdale Rd Unit 1, Naperville, IL 60564 and is currently estimated at $811,721, approximately $257 per square foot. 2412 Cloverdale Rd Unit 1 is a home located in Will County with nearby schools including Oliver Julian Kendall Elementary School, Ellsworth Elementary School, and Clifford Crone Middle School.
Ownership History
Date
Name
Owned For
Owner Type
Purchase Details
Closed on
Aug 16, 2011
Sold by
Bormet Sean E and Bormet Teri A
Bought by
Housholder Timothy J and Housholder Kathryn L
Current Estimated Value
Home Financials for this Owner
Home Financials are based on the most recent Mortgage that was taken out on this home.
Original Mortgage
$375,000
Outstanding Balance
$259,403
Interest Rate
4.55%
Mortgage Type
New Conventional
Estimated Equity
$552,318
Purchase Details
Closed on
May 9, 2003
Sold by
First Midwest Bank
Bought by
Bormet Sean E and Bormet Teri A
Home Financials for this Owner
Home Financials are based on the most recent Mortgage that was taken out on this home.
Original Mortgage
$377,620
Interest Rate
5%
Mortgage Type
Purchase Money Mortgage
Create a Home Valuation Report for This Property
The Home Valuation Report is an in-depth analysis detailing your home's value as well as a comparison with similar homes in the area
Home Values in the Area
Average Home Value in this Area
Purchase History
| Date | Buyer | Sale Price | Title Company |
|---|---|---|---|
| Housholder Timothy J | $475,000 | Wheatland Title Guaranty | |
| Bormet Sean E | $474,500 | Chicago Title Insurance Co |
Source: Public Records
Mortgage History
| Date | Status | Borrower | Loan Amount |
|---|---|---|---|
| Open | Housholder Timothy J | $375,000 | |
| Previous Owner | Bormet Sean E | $377,620 |
Source: Public Records
Tax History Compared to Growth
Tax History
| Year | Tax Paid | Tax Assessment Tax Assessment Total Assessment is a certain percentage of the fair market value that is determined by local assessors to be the total taxable value of land and additions on the property. | Land | Improvement |
|---|---|---|---|---|
| 2024 | $15,642 | $246,811 | $43,748 | $203,063 |
| 2023 | $15,642 | $218,031 | $38,647 | $179,384 |
| 2022 | $13,694 | $195,004 | $36,560 | $158,444 |
| 2021 | $13,694 | $185,718 | $34,819 | $150,899 |
| 2020 | $12,843 | $182,775 | $34,267 | $148,508 |
| 2019 | $12,624 | $177,624 | $33,301 | $144,323 |
| 2018 | $13,168 | $181,786 | $32,568 | $149,218 |
| 2017 | $12,479 | $177,093 | $31,727 | $145,366 |
| 2016 | $12,447 | $173,281 | $31,044 | $142,237 |
| 2015 | $12,573 | $166,616 | $29,850 | $136,766 |
| 2014 | $12,573 | $162,806 | $30,670 | $132,136 |
| 2013 | $12,573 | $156,346 | $30,670 | $125,676 |
Source: Public Records
Map
Nearby Homes
- 4007 Heron Ct Unit 1
- 2255 Wendt Cir
- 29W316 Andermann Dr
- 1736 Robert Ln
- 1804 Princess Cir
- 2711 Wait Rd
- 3707 Junebreeze Ln
- 3105 Saganashkee Ln
- 3616 Eliot Ln
- 3432 Redwing Dr Unit 2
- 1112 Saratoga Ct
- 24531 W 103rd St
- 3816 Rosada Dr
- 3432 Caine Dr
- 3420 Sunnyside Ct
- 11110 Highland Dr
- 3423 Sunnyside Ct
- 2949 Brossman St
- 2207 Sisters Ave
- 26106 W Sherwood Cir
- 2416 Cloverdale Rd
- 2408 Cloverdale Rd
- 2420 Cloverdale Rd
- 4103 Joe Willie Dr
- 4107 Joe Willie Dr
- 2504 Bangert Ln
- 2503 Bangert Ln
- 4111 Joe Willie Dr Unit 2
- 2424 Cloverdale Rd
- 2508 Bangert Ln Unit 2
- 4115 Joe Willie Dr
- 2403 Cloverdale Rd
- 4020 Heron Ct
- 2507 Bangert Ln
- 2428 Cloverdale Rd
- 4016 Heron Ct
- 4119 Joe Willie Dr
- 2512 Bangert Ln
- 4108 Joe Willie Dr
- 2324 Cloverdale Rd