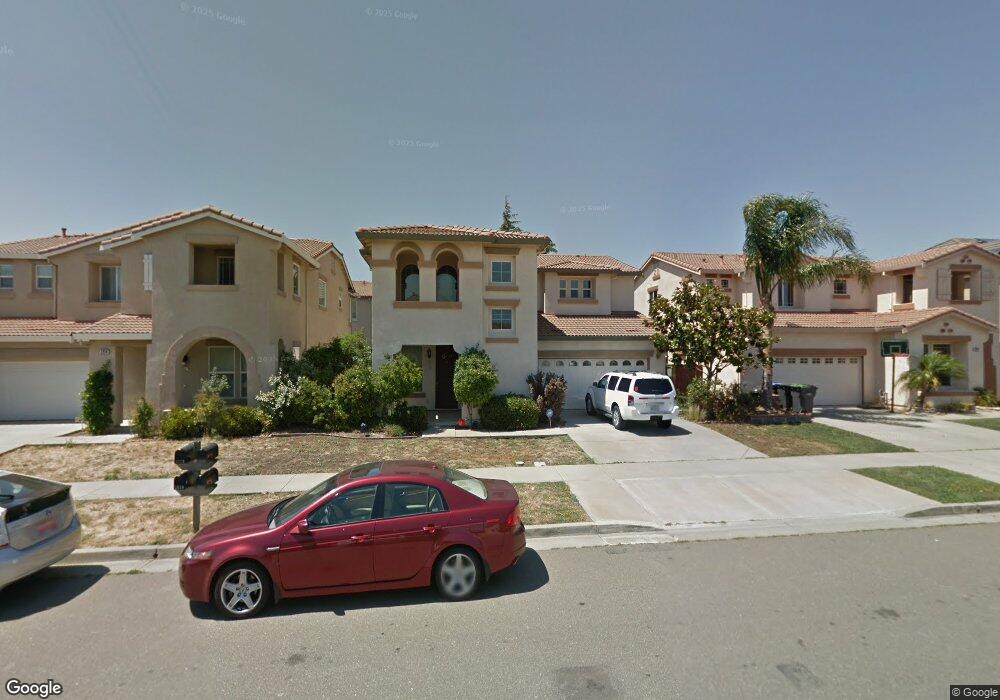
2418 Digerud Dr Fairfield, CA 94533
Estimated Value: $630,842 - $693,000
3
Beds
3
Baths
2,520
Sq Ft
$258/Sq Ft
Est. Value
About This Home
This home is located at 2418 Digerud Dr, Fairfield, CA 94533 and is currently estimated at $650,961, approximately $258 per square foot. 2418 Digerud Dr is a home located in Solano County with nearby schools including Center Elementary School, Golden West Middle School, and Vanden High School.
Ownership History
Date
Name
Owned For
Owner Type
Purchase Details
Closed on
Mar 28, 2013
Sold by
Brown Sidney D and Brown Susan A
Bought by
Kibby Road Llc
Current Estimated Value
Purchase Details
Closed on
Oct 14, 2004
Sold by
Murtagh Mary and Jacobson Fredric S
Bought by
Brown Sidney D and Brown Susan A
Home Financials for this Owner
Home Financials are based on the most recent Mortgage that was taken out on this home.
Original Mortgage
$398,400
Interest Rate
4.75%
Mortgage Type
Purchase Money Mortgage
Purchase Details
Closed on
Jul 26, 2004
Sold by
Western Pacific Housing Inc
Bought by
Jacobson Fredric S and Murtagh Mary
Home Financials for this Owner
Home Financials are based on the most recent Mortgage that was taken out on this home.
Original Mortgage
$309,211
Interest Rate
5.25%
Mortgage Type
Purchase Money Mortgage
Create a Home Valuation Report for This Property
The Home Valuation Report is an in-depth analysis detailing your home's value as well as a comparison with similar homes in the area
Home Values in the Area
Average Home Value in this Area
Purchase History
| Date | Buyer | Sale Price | Title Company |
|---|---|---|---|
| Kibby Road Llc | $285,000 | Fidelity National Title Co | |
| Brown Sidney D | $498,000 | Chicago Title Co | |
| Jacobson Fredric S | $387,000 | First American Title Co |
Source: Public Records
Mortgage History
| Date | Status | Borrower | Loan Amount |
|---|---|---|---|
| Previous Owner | Brown Sidney D | $398,400 | |
| Previous Owner | Jacobson Fredric S | $309,211 | |
| Closed | Brown Sidney D | $99,600 |
Source: Public Records
Tax History
| Year | Tax Paid | Tax Assessment Tax Assessment Total Assessment is a certain percentage of the fair market value that is determined by local assessors to be the total taxable value of land and additions on the property. | Land | Improvement |
|---|---|---|---|---|
| 2025 | $5,864 | $350,945 | $92,351 | $258,594 |
| 2024 | $5,864 | $344,065 | $90,541 | $253,524 |
| 2023 | $5,806 | $337,319 | $88,766 | $248,553 |
| 2022 | $5,481 | $330,706 | $87,026 | $243,680 |
| 2021 | $5,401 | $324,222 | $85,320 | $238,902 |
| 2020 | $5,326 | $320,899 | $84,446 | $236,453 |
| 2019 | $5,233 | $314,608 | $82,791 | $231,817 |
| 2018 | $5,161 | $308,440 | $81,168 | $227,272 |
| 2017 | $5,021 | $302,393 | $79,577 | $222,816 |
| 2016 | $4,951 | $296,465 | $78,017 | $218,448 |
| 2015 | $4,876 | $292,013 | $76,846 | $215,167 |
| 2014 | $4,790 | $286,294 | $75,341 | $210,953 |
Source: Public Records
Map
Nearby Homes
- 2428 Hanson Dr
- 2382 Sheldon Dr
- 2438 Sheldon Dr
- 2350 Sheldon Dr
- 2541 Rowe Dr
- 5161 Freitas Way
- 5138 Rowe Dr
- 2738 Blakely Ln
- 2319 Hancock Dr
- 5291 Finkas Ln
- 2433 Sanders Ln
- 5311 Gramercy Cir
- 2746 Gracie Place
- 2481 Hancock Dr
- 2404 Indigo Dr
- 2426 Lake Club Dr
- 2429 Artisan Way
- 2432 Artisan Way
- 2464 Lake Club Dr
- 5987 Big Sky Dr
- 2414 Digerud Dr
- 2422 Digerud Dr
- 2369 Flatley Cir
- 2365 Flatley Cir
- 2410 Digerud Dr
- 2426 Digerud Dr
- 2373 Flatley Cir
- 2406 Digerud Dr
- 2415 Digerud Dr
- 2430 Digerud Dr
- 2419 Digerud Dr
- 2423 Digerud Dr
- 2411 Digerud Dr
- 2377 Flatley Cir
- 2357 Flatley Cir
- 2407 Digerud Dr
- 2427 Digerud Dr
- 5065 Lockie Ln
- 2402 Digerud Dr
Your Personal Tour Guide
Ask me questions while you tour the home.