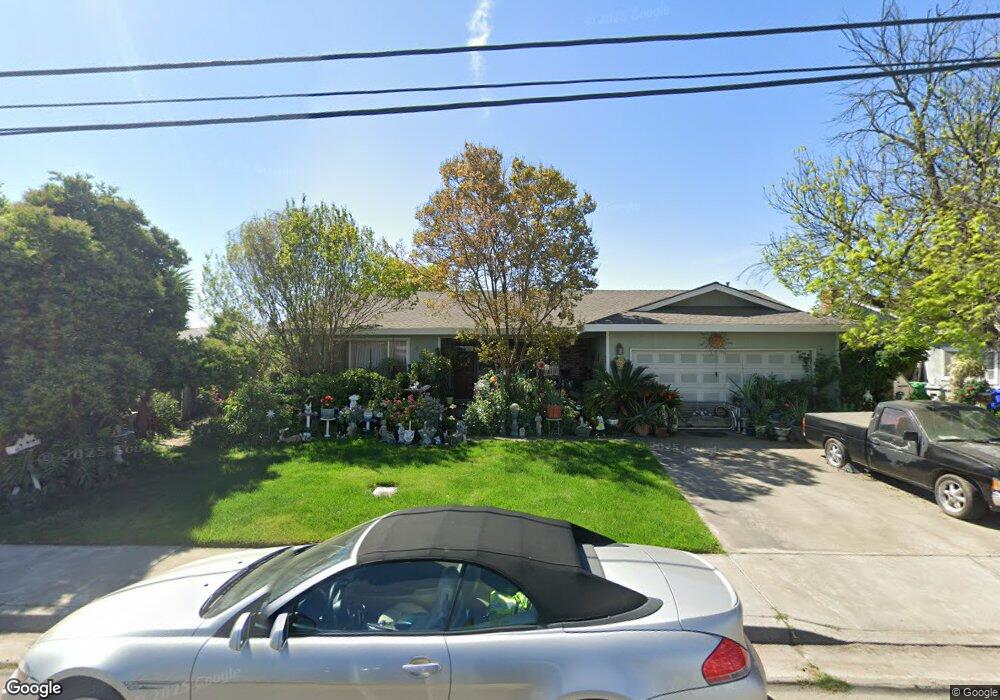
2420 Fruitland Ave Atwater, CA 95301
Estimated Value: $354,000 - $435,000
3
Beds
2
Baths
1,766
Sq Ft
$228/Sq Ft
Est. Value
About This Home
This home is located at 2420 Fruitland Ave, Atwater, CA 95301 and is currently estimated at $402,832, approximately $228 per square foot. 2420 Fruitland Ave is a home located in Merced County with nearby schools including Elmer Wood Elementary School, Mitchell Intermediate School, and Atwater High School.
Ownership History
Date
Name
Owned For
Owner Type
Purchase Details
Closed on
Mar 31, 2009
Sold by
Hsbc Bank Usa National Association
Bought by
Muro Digna
Current Estimated Value
Home Financials for this Owner
Home Financials are based on the most recent Mortgage that was taken out on this home.
Original Mortgage
$109,971
Interest Rate
5.09%
Mortgage Type
FHA
Purchase Details
Closed on
Mar 31, 2008
Sold by
Davis John and Davis Kathy
Bought by
Hsbc Bank Usa Na and Peoples Choice Home Loan Securities Tr
Purchase Details
Closed on
Mar 20, 1998
Sold by
Navy Fcu
Bought by
Davis John and Davis Kathy
Home Financials for this Owner
Home Financials are based on the most recent Mortgage that was taken out on this home.
Original Mortgage
$96,933
Interest Rate
7.07%
Mortgage Type
FHA
Purchase Details
Closed on
Sep 11, 1997
Sold by
Marie Monreal Conrad and Marie Kynne
Bought by
Navy Fcu
Create a Home Valuation Report for This Property
The Home Valuation Report is an in-depth analysis detailing your home's value as well as a comparison with similar homes in the area
Home Values in the Area
Average Home Value in this Area
Purchase History
| Date | Buyer | Sale Price | Title Company |
|---|---|---|---|
| Muro Digna | $106,000 | Fidelity National Title Co | |
| Hsbc Bank Usa Na | $146,400 | None Available | |
| Davis John | $97,000 | Fidelity National Title Co | |
| Navy Fcu | $23,578 | Fidelity National Title Ins |
Source: Public Records
Mortgage History
| Date | Status | Borrower | Loan Amount |
|---|---|---|---|
| Previous Owner | Muro Digna | $109,971 | |
| Previous Owner | Davis John | $96,933 |
Source: Public Records
Tax History Compared to Growth
Tax History
| Year | Tax Paid | Tax Assessment Tax Assessment Total Assessment is a certain percentage of the fair market value that is determined by local assessors to be the total taxable value of land and additions on the property. | Land | Improvement |
|---|---|---|---|---|
| 2025 | $1,468 | $144,557 | $32,263 | $112,294 |
| 2024 | $1,468 | $141,724 | $31,631 | $110,093 |
| 2023 | $1,429 | $138,946 | $31,011 | $107,935 |
| 2022 | $1,411 | $136,222 | $30,403 | $105,819 |
| 2021 | $1,411 | $133,552 | $29,807 | $103,745 |
| 2020 | $1,394 | $132,184 | $29,502 | $102,682 |
| 2019 | $1,334 | $129,593 | $28,924 | $100,669 |
| 2018 | $1,299 | $127,053 | $28,357 | $98,696 |
| 2017 | $1,281 | $124,562 | $27,801 | $96,761 |
| 2016 | $1,259 | $122,120 | $27,256 | $94,864 |
| 2015 | $1,243 | $120,287 | $26,847 | $93,440 |
| 2014 | $1,212 | $117,932 | $26,322 | $91,610 |
Source: Public Records
Map
Nearby Homes
- 3330 Virginia St
- 2451 Brodalski St
- 3337 Stacey Ct
- 3435 Suzanne Ct
- 3466 Village Woods Dr
- 2324 Crestview Dr
- 2543 Briarwood St
- 3478 Carrie Ct
- 2709 Hillcrest St
- 5607 Celestial Dr
- 1500 Marguerite St
- 1220 Bellevue Rd
- 0 Redwood Ave Unit 225133534
- 0 Redwood Ave Unit MC25237349
- 7353 Reece Wade Ct
- 1485 Mulberry Ave
- 2430 Fruitland Ave
- 3051 Virginia St
- 3041 Virginia St
- 2419 Koehn Ct
- 2429 Koehn Ct
- 2450 Fruitland Ave
- 3031 Virginia St
- 2421 Fruitland Ave
- 2431 Fruitland Ave
- 2451 Koehn Ct
- 2405 Fruitland Ave
- 2470 Fruitland Ave
- 2390 Fruitland Ave
- 3116 Dakota St
- 3103 Dakota St
- 2450 Koehn Ct
- 3115 Virginia St
- 3042 Virginia St
- 3017 Virginia St
- 2410 Koehn Ct