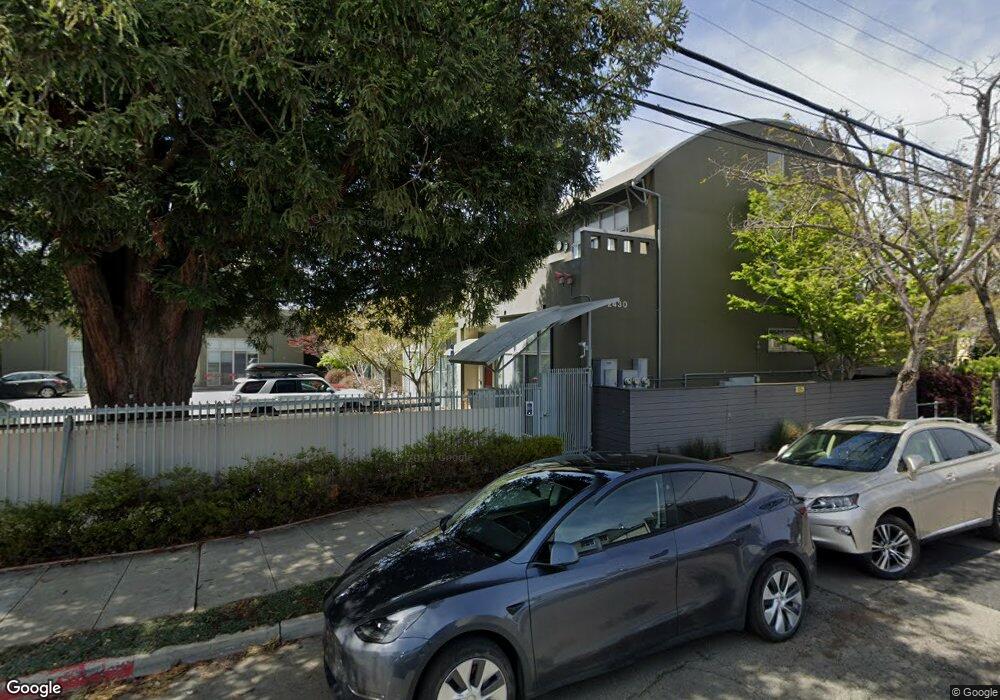
2430 5th St Unit G Berkeley, CA 94710
West Berkeley NeighborhoodEstimated Value: $850,000 - $1,000,000
2
Beds
2
Baths
1,391
Sq Ft
$653/Sq Ft
Est. Value
About This Home
This home is located at 2430 5th St Unit G, Berkeley, CA 94710 and is currently estimated at $908,216, approximately $652 per square foot. 2430 5th St Unit G is a home located in Alameda County with nearby schools including Rosa Parks Elementary School, Ruth Acty Elementary, and Berkeley Arts Magnet at Whittier School.
Ownership History
Date
Name
Owned For
Owner Type
Purchase Details
Closed on
Jun 11, 2014
Sold by
Lorraine Bouyssou Serge and Lorraine Fenaille
Bought by
Walker Robert M and Carlson Rowena M
Current Estimated Value
Home Financials for this Owner
Home Financials are based on the most recent Mortgage that was taken out on this home.
Original Mortgage
$472,000
Outstanding Balance
$358,608
Interest Rate
4.17%
Mortgage Type
New Conventional
Estimated Equity
$549,608
Purchase Details
Closed on
Feb 21, 2012
Sold by
The Bank Of New York Mellon
Bought by
Lorraine Bouyssou Serge and Lorraine Fenaille
Home Financials for this Owner
Home Financials are based on the most recent Mortgage that was taken out on this home.
Original Mortgage
$238,150
Interest Rate
3.83%
Mortgage Type
New Conventional
Purchase Details
Closed on
Sep 12, 2011
Sold by
Leung Ray Wang Yan
Bought by
The Bank Of New York Mellon
Create a Home Valuation Report for This Property
The Home Valuation Report is an in-depth analysis detailing your home's value as well as a comparison with similar homes in the area
Home Values in the Area
Average Home Value in this Area
Purchase History
| Date | Buyer | Sale Price | Title Company |
|---|---|---|---|
| Walker Robert M | $590,000 | Placer Title Company | |
| Lorraine Bouyssou Serge | $298,000 | Landsafe Title | |
| The Bank Of New York Mellon | $371,250 | Landsafe Title |
Source: Public Records
Mortgage History
| Date | Status | Borrower | Loan Amount |
|---|---|---|---|
| Open | Walker Robert M | $472,000 | |
| Previous Owner | Lorraine Bouyssou Serge | $238,150 |
Source: Public Records
Tax History Compared to Growth
Tax History
| Year | Tax Paid | Tax Assessment Tax Assessment Total Assessment is a certain percentage of the fair market value that is determined by local assessors to be the total taxable value of land and additions on the property. | Land | Improvement |
|---|---|---|---|---|
| 2025 | $10,966 | $716,227 | $216,968 | $506,259 |
| 2024 | $10,966 | $702,050 | $212,715 | $496,335 |
| 2023 | $10,738 | $695,148 | $208,544 | $486,604 |
| 2022 | $10,545 | $674,520 | $204,456 | $477,064 |
| 2021 | $10,570 | $661,162 | $200,448 | $467,714 |
| 2020 | $10,007 | $661,312 | $198,393 | $462,919 |
| 2019 | $9,704 | $648,350 | $194,505 | $453,845 |
| 2018 | $9,544 | $635,641 | $190,692 | $444,949 |
| 2017 | $9,211 | $623,181 | $186,954 | $436,227 |
| 2016 | $8,920 | $610,961 | $183,288 | $427,673 |
| 2015 | $8,803 | $601,787 | $180,536 | $421,251 |
| 2014 | $5,198 | $305,031 | $91,499 | $213,532 |
Source: Public Records
Map
Nearby Homes
- 739 Channing Way
- 2413 7th St
- 2310 Eighth St
- 2220 7th St
- 2406 10th St
- 2326 10th St
- 1050 Allston Way
- 1092 Dwight Way
- 1018 Bancroft Way
- 2120 6th St Unit 10
- 816 Addison St
- 1118 Dwight Way
- 1010 Grayson St
- 1009 Addison St
- 2747 San Pablo Ave Unit 406
- 2747 San Pablo Ave Unit 217
- 2703 Mathews St
- 1914 7th St Unit B
- 1814 Sixth St
- 1311 Derby St
- 2430 5th St Unit STE
- 2430 5th St Unit N
- 2430 5th St Unit M
- 2430 5th St Unit L
- 2430 5th St Unit K
- 2430 5th St Unit J
- 2430 5th St Unit I
- 2430 5th St Unit H
- 2430 5th St Unit F
- 2430 5th St Unit E
- 2430 5th St Unit C
- 2430 5th St Unit B
- 2430 5th St Unit A
- 2422 5th St
- 2418 5th St Unit B
- 2418 5th St Unit 1
- 2416 5th St
- 2414 5th St
- 2421 5th St
- 2415 5th St