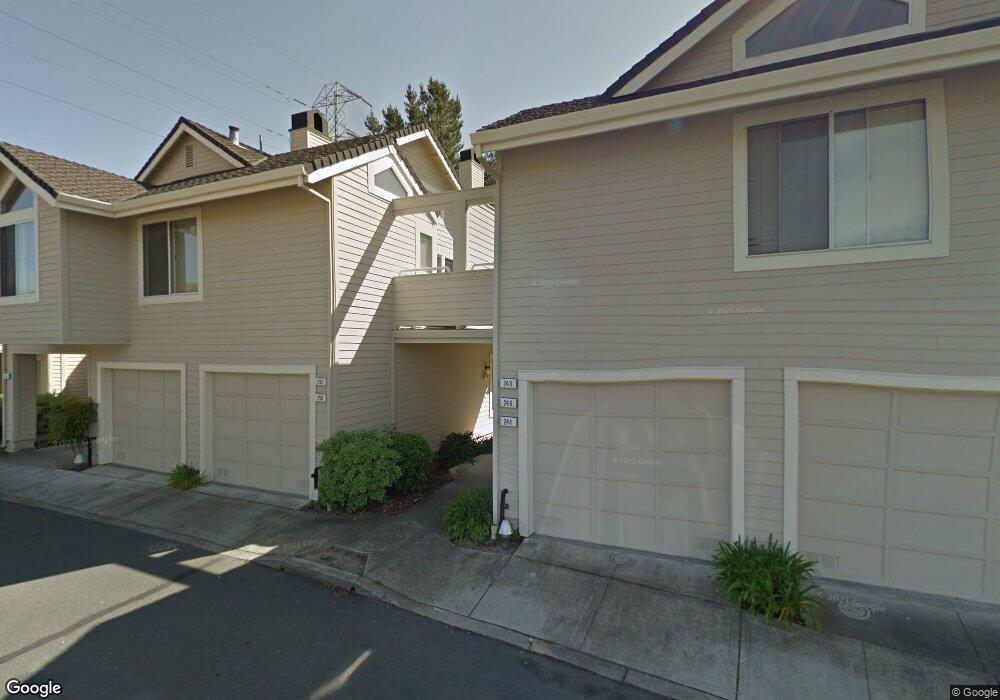
246 Sunset Dr Unit 246 Hercules, CA 94547
Estimated Value: $418,478 - $476,000
2
Beds
2
Baths
988
Sq Ft
$455/Sq Ft
Est. Value
About This Home
This home is located at 246 Sunset Dr Unit 246, Hercules, CA 94547 and is currently estimated at $449,120, approximately $454 per square foot. 246 Sunset Dr Unit 246 is a home located in Contra Costa County with nearby schools including Hanna Ranch Elementary School, Hercules Middle School, and Hercules High School.
Ownership History
Date
Name
Owned For
Owner Type
Purchase Details
Closed on
Feb 22, 2012
Sold by
Dela Torre Joey S
Bought by
Marnicore Llc
Current Estimated Value
Purchase Details
Closed on
Oct 25, 2001
Sold by
Delatorre Emiliano and Delatorre Fulcida S
Bought by
Delatorre Joey S
Home Financials for this Owner
Home Financials are based on the most recent Mortgage that was taken out on this home.
Original Mortgage
$169,000
Interest Rate
6.84%
Mortgage Type
Purchase Money Mortgage
Purchase Details
Closed on
Nov 28, 1995
Sold by
Lewis Ronald and Lewis Christine
Bought by
Delatorre Joey S and Delatorre Emiliano O
Home Financials for this Owner
Home Financials are based on the most recent Mortgage that was taken out on this home.
Original Mortgage
$107,640
Interest Rate
7.48%
Mortgage Type
FHA
Create a Home Valuation Report for This Property
The Home Valuation Report is an in-depth analysis detailing your home's value as well as a comparison with similar homes in the area
Home Values in the Area
Average Home Value in this Area
Purchase History
| Date | Buyer | Sale Price | Title Company |
|---|---|---|---|
| Marnicore Llc | $98,500 | None Available | |
| Delatorre Joey S | -- | Alliance Title Company | |
| Delatorre Joey S | $110,500 | North American Title Co | |
| Delatorre Joey S | -- | North American Title Co |
Source: Public Records
Mortgage History
| Date | Status | Borrower | Loan Amount |
|---|---|---|---|
| Previous Owner | Delatorre Joey S | $169,000 | |
| Previous Owner | Delatorre Joey S | $107,640 |
Source: Public Records
Tax History
| Year | Tax Paid | Tax Assessment Tax Assessment Total Assessment is a certain percentage of the fair market value that is determined by local assessors to be the total taxable value of land and additions on the property. | Land | Improvement |
|---|---|---|---|---|
| 2025 | $3,083 | $123,708 | $41,443 | $82,265 |
| 2024 | $2,930 | $121,283 | $40,631 | $80,652 |
| 2023 | $2,930 | $118,906 | $39,835 | $79,071 |
| 2022 | $2,895 | $116,575 | $39,054 | $77,521 |
| 2021 | $2,886 | $114,290 | $38,289 | $76,001 |
| 2019 | $2,778 | $110,902 | $37,154 | $73,748 |
| 2018 | $2,719 | $108,728 | $36,426 | $72,302 |
| 2017 | $2,690 | $106,597 | $35,712 | $70,885 |
| 2016 | $2,503 | $104,508 | $35,012 | $69,496 |
| 2015 | $2,503 | $102,940 | $34,487 | $68,453 |
| 2014 | $2,529 | $100,925 | $33,812 | $67,113 |
Source: Public Records
Map
Nearby Homes
- 301 Boatswain Ct
- 161 Seaway Ct
- 256 Napoli Ct Unit 256
- 103 Tuscany Ct
- 139 Tuscany Ct Unit 139
- 248 Carson St
- 134 Caprice Cir
- 118 Cottonwood Ct
- 211 Meadowlark Way
- 2555 Arroyo Ave
- 2620 Shady Draw
- 2654 Tamalpais Dr Unit 38
- 1723 Pheasant Dr
- 405 Weymouth
- 103 Obsidian Way
- 704 Windsor Unit 704
- 120 Bonita Ct
- 2420 Tomar Ct
- 2413 Christian Ct
- 176 Bedford
- 244 Sunset Dr
- 248 Sunset Dr Unit 248
- 252 Sunset Dr Unit 252
- 238 Sunset Dr
- 240 Sunset Dr Unit 240
- 242 Sunset Dr Unit 242
- 250 Sunset Dr
- 254 Sunset Dr Unit 254
- 256 Sunset Dr Unit 256
- 258 Sunset Dr
- 236 Sunset Dr
- 232 Sunset Dr Unit 232
- 234 Sunset Dr
- 260 Sunset Dr
- 230 Sunset Dr
- 222 Sunset Dr
- 228 Sunset Dr
- 220 Sunset Dr Unit 220
- 218 Sunset Dr
- 262 Scupper Ct
Your Personal Tour Guide
Ask me questions while you tour the home.