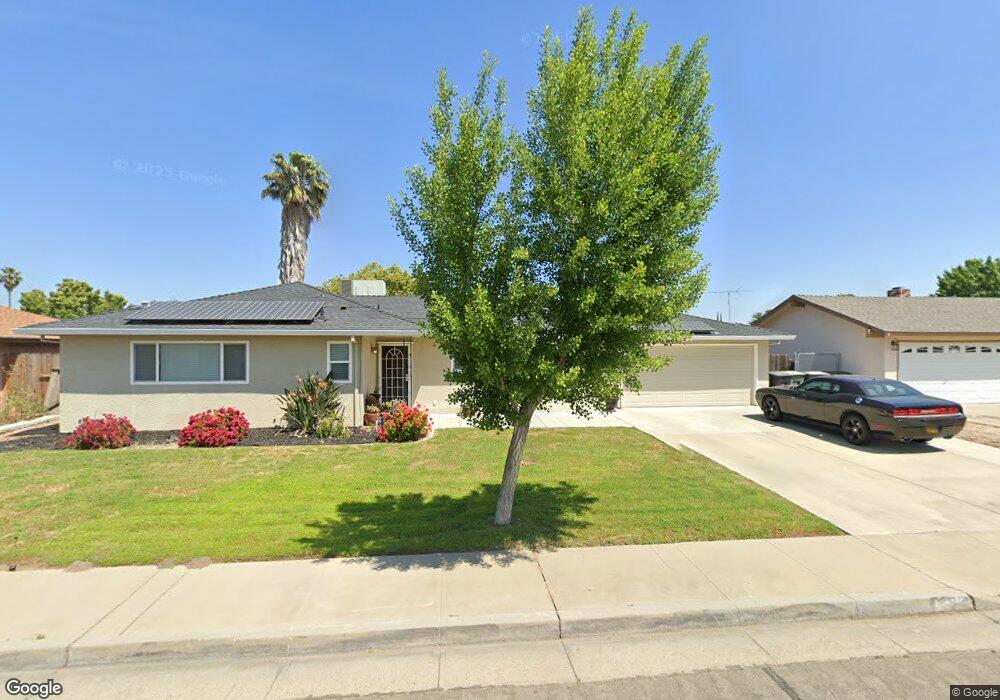
251 Pacemaker Dr Atwater, CA 95301
Estimated Value: $257,000 - $380,000
3
Beds
2
Baths
1,238
Sq Ft
$272/Sq Ft
Est. Value
About This Home
This home is located at 251 Pacemaker Dr, Atwater, CA 95301 and is currently estimated at $337,202, approximately $272 per square foot. 251 Pacemaker Dr is a home located in Merced County with nearby schools including Thomas Olaeta Elementary School, Mitchell Intermediate School, and Buhach Colony High School.
Ownership History
Date
Name
Owned For
Owner Type
Purchase Details
Closed on
Mar 19, 2010
Sold by
Rouse Tiann M
Bought by
Castro Adam A
Current Estimated Value
Home Financials for this Owner
Home Financials are based on the most recent Mortgage that was taken out on this home.
Original Mortgage
$127,500
Outstanding Balance
$84,631
Interest Rate
5.01%
Mortgage Type
New Conventional
Estimated Equity
$252,571
Purchase Details
Closed on
Mar 18, 2010
Sold by
Wiren Paul A
Bought by
Castro Adam S and Gonzalez Rafael V
Home Financials for this Owner
Home Financials are based on the most recent Mortgage that was taken out on this home.
Original Mortgage
$127,500
Outstanding Balance
$84,631
Interest Rate
5.01%
Mortgage Type
New Conventional
Estimated Equity
$252,571
Purchase Details
Closed on
Apr 19, 2003
Sold by
Harris Gerald C and Wiren Paul A
Bought by
Wiren Paul A
Create a Home Valuation Report for This Property
The Home Valuation Report is an in-depth analysis detailing your home's value as well as a comparison with similar homes in the area
Home Values in the Area
Average Home Value in this Area
Purchase History
| Date | Buyer | Sale Price | Title Company |
|---|---|---|---|
| Castro Adam A | -- | Transcounty Title Company | |
| Castro Adam S | $125,000 | Transcounty Title Company | |
| Wiren Paul A | -- | -- |
Source: Public Records
Mortgage History
| Date | Status | Borrower | Loan Amount |
|---|---|---|---|
| Open | Castro Adam S | $127,500 |
Source: Public Records
Tax History
| Year | Tax Paid | Tax Assessment Tax Assessment Total Assessment is a certain percentage of the fair market value that is determined by local assessors to be the total taxable value of land and additions on the property. | Land | Improvement |
|---|---|---|---|---|
| 2025 | $1,785 | $167,705 | $12,901 | $154,804 |
| 2024 | $1,785 | $164,418 | $12,649 | $151,769 |
| 2023 | $1,739 | $161,195 | $12,401 | $148,794 |
| 2022 | $1,655 | $152,035 | $12,158 | $139,877 |
| 2021 | $1,658 | $149,055 | $11,920 | $137,135 |
| 2020 | $1,639 | $147,527 | $11,798 | $135,729 |
| 2019 | $1,569 | $144,635 | $11,567 | $133,068 |
| 2018 | $1,530 | $141,800 | $11,341 | $130,459 |
| 2017 | $1,511 | $139,020 | $11,119 | $127,901 |
| 2016 | $1,487 | $136,295 | $10,901 | $125,394 |
| 2015 | $1,469 | $134,249 | $10,738 | $123,511 |
| 2014 | $1,417 | $130,000 | $30,000 | $100,000 |
Source: Public Records
Map
Nearby Homes
- 0 Alabama St Unit MC25081689
- 0 Alabama St Unit MC25081688
- 0 Alabama St Unit MC25081690
- 1675 Almador Terrace
- 2310 Linden St
- 517 E Grove Ave
- 1160 Oak Ave
- 1510 High St
- 1652 Chaparral Ct
- 1739 1st St
- 1739 First St
- 288 E Fir Ave
- 1263 Juniper Ave
- 2900 Los Altos Ct
- 401 Cedar Ave
- 1053 Huntingdale Way
- 2900 Muir Ave Unit 85
- 42 Rancho Grande Cir
- 42 Rancho Grande Cir Unit 42
- 1485 Mulberry Ave
Your Personal Tour Guide
Ask me questions while you tour the home.