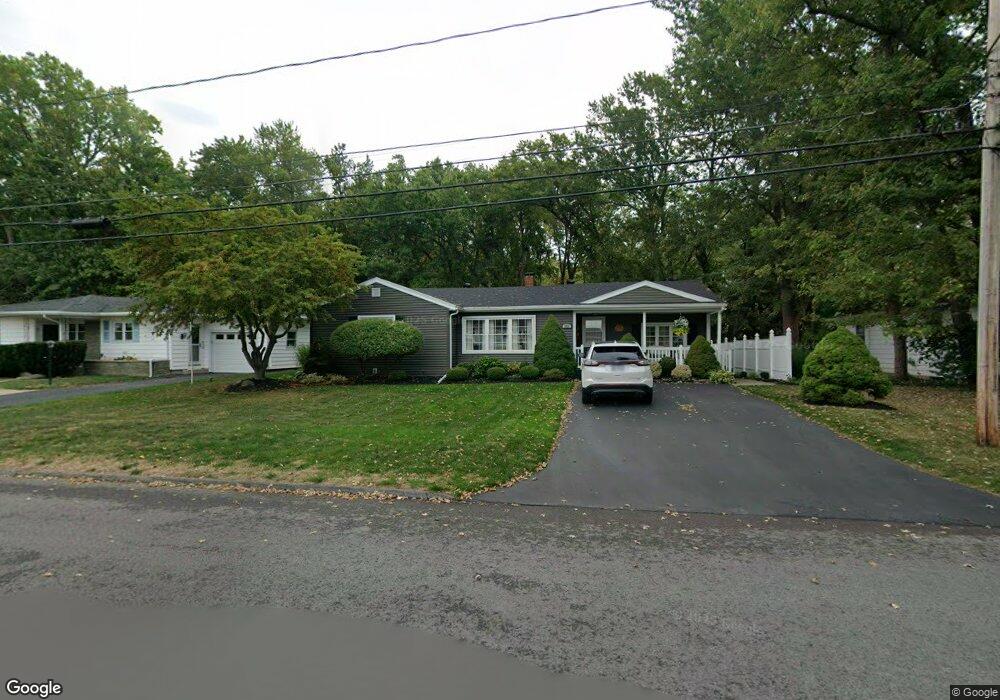
252 Ross St Batavia, NY 14020
Estimated Value: $229,294 - $239,000
3
Beds
1
Bath
1,605
Sq Ft
$147/Sq Ft
Est. Value
About This Home
This home is located at 252 Ross St, Batavia, NY 14020 and is currently estimated at $235,574, approximately $146 per square foot. 252 Ross St is a home located in Genesee County with nearby schools including Jackson Primary School, John Kennedy Intermediate School, and Batavia Middle School.
Ownership History
Date
Name
Owned For
Owner Type
Purchase Details
Closed on
Apr 13, 2010
Sold by
Callan Chelsea M
Bought by
Pellegrino Rocco
Current Estimated Value
Purchase Details
Closed on
Jun 11, 2007
Sold by
Reinhart Enterprises Inc
Bought by
Callan Chelsie M
Home Financials for this Owner
Home Financials are based on the most recent Mortgage that was taken out on this home.
Original Mortgage
$104,500
Interest Rate
6.17%
Mortgage Type
Purchase Money Mortgage
Purchase Details
Closed on
Jan 16, 1998
Create a Home Valuation Report for This Property
The Home Valuation Report is an in-depth analysis detailing your home's value as well as a comparison with similar homes in the area
Home Values in the Area
Average Home Value in this Area
Purchase History
| Date | Buyer | Sale Price | Title Company |
|---|---|---|---|
| Pellegrino Rocco | $120,000 | Paula Campbell | |
| Callan Chelsie M | $107,000 | Theron Howard | |
| -- | -- | -- |
Source: Public Records
Mortgage History
| Date | Status | Borrower | Loan Amount |
|---|---|---|---|
| Previous Owner | Callan Chelsie M | $104,500 |
Source: Public Records
Tax History Compared to Growth
Tax History
| Year | Tax Paid | Tax Assessment Tax Assessment Total Assessment is a certain percentage of the fair market value that is determined by local assessors to be the total taxable value of land and additions on the property. | Land | Improvement |
|---|---|---|---|---|
| 2024 | $2,828 | $207,000 | $21,600 | $185,400 |
| 2023 | $1,309 | $177,000 | $21,600 | $155,400 |
| 2022 | $3,288 | $177,000 | $21,600 | $155,400 |
| 2021 | $3,055 | $150,000 | $21,600 | $128,400 |
| 2020 | $3,891 | $127,000 | $21,600 | $105,400 |
| 2019 | $2,894 | $127,000 | $21,600 | $105,400 |
| 2018 | $2,894 | $127,000 | $21,600 | $105,400 |
| 2017 | $2,926 | $127,000 | $21,600 | $105,400 |
| 2016 | $2,741 | $117,000 | $21,600 | $95,400 |
| 2015 | -- | $117,000 | $21,600 | $95,400 |
| 2014 | -- | $117,000 | $21,600 | $95,400 |
Source: Public Records
Map
Nearby Homes