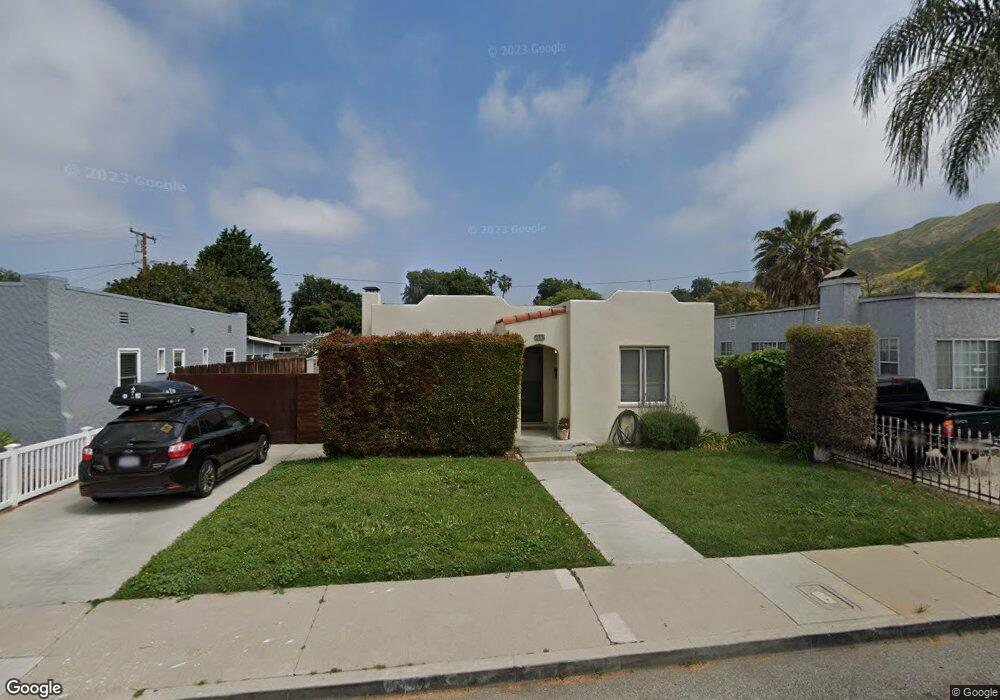
253 E Lewis St Ventura, CA 93001
Westside NeighborhoodEstimated Value: $559,000 - $733,000
2
Beds
1
Bath
880
Sq Ft
$750/Sq Ft
Est. Value
About This Home
This home is located at 253 E Lewis St, Ventura, CA 93001 and is currently estimated at $659,731, approximately $749 per square foot. 253 E Lewis St is a home located in Ventura County with nearby schools including E.P. Foster Elementary School, De Anza Academy Of Technology And The Arts, and Ventura High School.
Ownership History
Date
Name
Owned For
Owner Type
Purchase Details
Closed on
Sep 20, 2001
Sold by
Polley Lisa and Polley Brian J J
Bought by
Polley Brian J J and Polley Lisa
Current Estimated Value
Home Financials for this Owner
Home Financials are based on the most recent Mortgage that was taken out on this home.
Original Mortgage
$145,000
Outstanding Balance
$56,213
Interest Rate
6.91%
Estimated Equity
$603,518
Purchase Details
Closed on
Feb 4, 1999
Sold by
Quill Thomas E
Bought by
Mcnerney Lisa and Polley Brian J J
Home Financials for this Owner
Home Financials are based on the most recent Mortgage that was taken out on this home.
Original Mortgage
$132,116
Interest Rate
6.77%
Mortgage Type
FHA
Purchase Details
Closed on
Jul 14, 1994
Sold by
Sanwa Bank California
Bought by
Quill Thomas E
Home Financials for this Owner
Home Financials are based on the most recent Mortgage that was taken out on this home.
Original Mortgage
$93,596
Interest Rate
5.12%
Purchase Details
Closed on
May 11, 1994
Sold by
T D Service Company
Bought by
Sanwa Bank California
Create a Home Valuation Report for This Property
The Home Valuation Report is an in-depth analysis detailing your home's value as well as a comparison with similar homes in the area
Home Values in the Area
Average Home Value in this Area
Purchase History
| Date | Buyer | Sale Price | Title Company |
|---|---|---|---|
| Polley Brian J J | -- | American Title Co | |
| Mcnerney Lisa | $133,000 | American Title Co | |
| Quill Thomas E | $117,000 | Chicago Title Co | |
| Sanwa Bank California | $108,338 | First American Title Ins Co |
Source: Public Records
Mortgage History
| Date | Status | Borrower | Loan Amount |
|---|---|---|---|
| Open | Polley Brian J J | $145,000 | |
| Closed | Mcnerney Lisa | $132,116 | |
| Previous Owner | Quill Thomas E | $93,596 |
Source: Public Records
Tax History
| Year | Tax Paid | Tax Assessment Tax Assessment Total Assessment is a certain percentage of the fair market value that is determined by local assessors to be the total taxable value of land and additions on the property. | Land | Improvement |
|---|---|---|---|---|
| 2025 | $2,339 | $208,473 | $180,272 | $28,201 |
| 2024 | $2,339 | $204,386 | $176,737 | $27,649 |
| 2023 | $2,312 | $200,379 | $173,272 | $27,107 |
| 2022 | $2,158 | $196,450 | $169,874 | $26,576 |
| 2021 | $2,118 | $192,599 | $166,544 | $26,055 |
| 2020 | $2,098 | $190,627 | $164,838 | $25,789 |
| 2019 | $2,061 | $186,890 | $161,606 | $25,284 |
| 2018 | $2,028 | $183,227 | $158,438 | $24,789 |
| 2017 | $1,986 | $179,635 | $155,332 | $24,303 |
| 2016 | $1,949 | $176,114 | $152,287 | $23,827 |
| 2015 | $1,929 | $173,470 | $150,000 | $23,470 |
| 2014 | $1,899 | $170,073 | $147,062 | $23,011 |
Source: Public Records
Map
Nearby Homes
- 154 El Medio St
- 90 Leighton Dr
- 121 E Warner St
- 212 E Barnett St
- 103 Comstock Dr
- 852 N Ventura Ave
- 614 Cedar St
- 557 561 N North Olive St
- 531 Cedar St
- 57 E Center St
- 176 W Ramona St
- 818 Caliente Ln
- 911 Vallecito Dr
- 2277 Cayuse Ln
- 335 W Simpson St
- 2349 Aztec Ave
- 2350 Hopi Ln
- 320 N Ventura Ave
- 323 Wall St
- 2389 N Ventura Ave
Your Personal Tour Guide
Ask me questions while you tour the home.