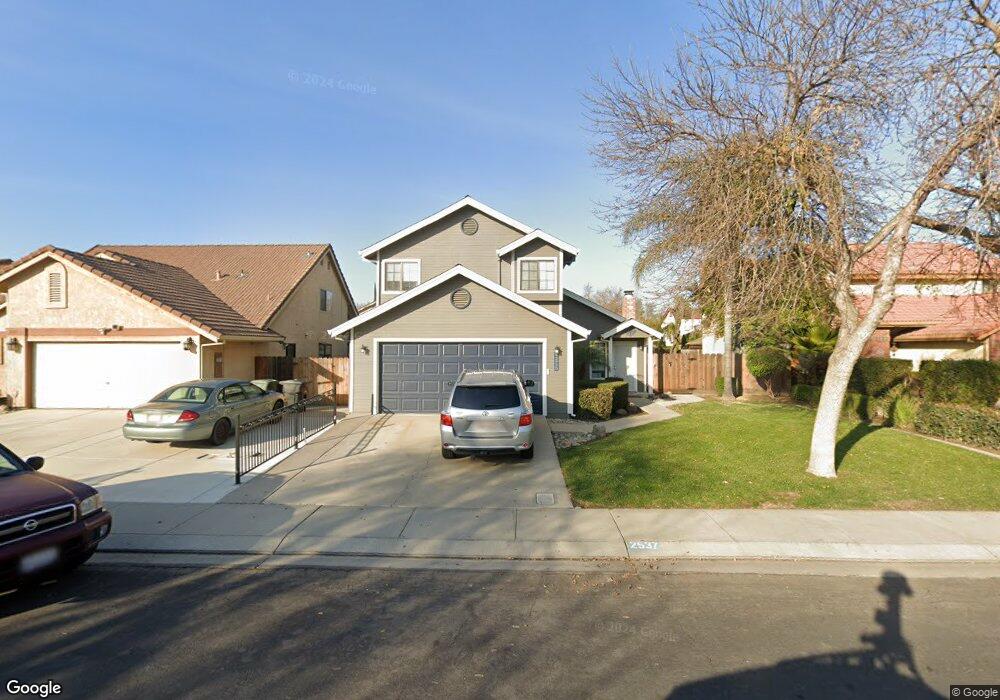
2537 Walnut Park Dr Modesto, CA 95355
Northeast Modesto NeighborhoodEstimated Value: $433,000 - $447,785
3
Beds
3
Baths
1,514
Sq Ft
$291/Sq Ft
Est. Value
About This Home
This home is located at 2537 Walnut Park Dr, Modesto, CA 95355 and is currently estimated at $440,196, approximately $290 per square foot. 2537 Walnut Park Dr is a home located in Stanislaus County with nearby schools including Orchard Elementary School, Daniel J. Savage Middle School, and James C. Enochs High School.
Ownership History
Date
Name
Owned For
Owner Type
Purchase Details
Closed on
Sep 1, 2000
Sold by
Luderman Herbert R and Luderman Kathleen A
Bought by
Cash Jerry L and Cash Nancy A
Current Estimated Value
Home Financials for this Owner
Home Financials are based on the most recent Mortgage that was taken out on this home.
Original Mortgage
$110,800
Outstanding Balance
$39,494
Interest Rate
7.98%
Estimated Equity
$400,702
Purchase Details
Closed on
Dec 14, 1999
Sold by
H & K Investment Company Llc
Bought by
Luderman Herbert R and Luderman Kathleen A
Purchase Details
Closed on
Aug 4, 1999
Sold by
Stoll Harold and Stoll Sandra M
Bought by
H & K Investment Company Llc
Purchase Details
Closed on
Jan 26, 1994
Sold by
Omundson Joseph Lee and Omundson Nancy Renee
Bought by
Stoll Harold and Stoll Sandra M
Home Financials for this Owner
Home Financials are based on the most recent Mortgage that was taken out on this home.
Original Mortgage
$92,800
Interest Rate
7.1%
Create a Home Valuation Report for This Property
The Home Valuation Report is an in-depth analysis detailing your home's value as well as a comparison with similar homes in the area
Home Values in the Area
Average Home Value in this Area
Purchase History
| Date | Buyer | Sale Price | Title Company |
|---|---|---|---|
| Cash Jerry L | $138,500 | Fidelity National Title Co | |
| Luderman Herbert R | -- | -- | |
| H & K Investment Company Llc | $128,000 | Chicago Title Co | |
| Stoll Harold | $116,000 | First American Title Co |
Source: Public Records
Mortgage History
| Date | Status | Borrower | Loan Amount |
|---|---|---|---|
| Open | Cash Jerry L | $110,800 | |
| Previous Owner | Stoll Harold | $92,800 |
Source: Public Records
Tax History
| Year | Tax Paid | Tax Assessment Tax Assessment Total Assessment is a certain percentage of the fair market value that is determined by local assessors to be the total taxable value of land and additions on the property. | Land | Improvement |
|---|---|---|---|---|
| 2025 | $2,306 | $208,674 | $45,192 | $163,482 |
| 2024 | $2,264 | $204,583 | $44,306 | $160,277 |
| 2023 | $2,221 | $200,573 | $43,438 | $157,135 |
| 2022 | $2,131 | $196,641 | $42,587 | $154,054 |
| 2021 | $2,094 | $192,786 | $41,752 | $151,034 |
| 2020 | $2,064 | $190,810 | $41,324 | $149,486 |
| 2019 | $2,026 | $187,069 | $40,514 | $146,555 |
| 2018 | $1,986 | $183,402 | $39,720 | $143,682 |
| 2017 | $1,939 | $179,807 | $38,942 | $140,865 |
| 2016 | $1,928 | $176,282 | $38,179 | $138,103 |
| 2015 | $1,900 | $173,635 | $37,606 | $136,029 |
| 2014 | $1,893 | $170,235 | $36,870 | $133,365 |
Source: Public Records
Map
Nearby Homes
- 2429 Woodvale Dr
- 2604 Lincoln Oak Ct
- 2400 Walnut Grove Way
- 0 Claus Rd Unit 225136410
- 2204 Orchard Park Way
- 2408 Beatrice Ln
- 2209 Perth Dr
- 2413 Ventana View Way
- 2316 Mountain Quail Way
- 1713 Walnut Blossom Way
- 2113 Milford Ln
- 2924 Merle Ave
- 2101 Milford Ln
- 2932 Alcott Ct
- 2307 Oakdale Rd Unit 13
- 3013 Da Vinci Ct
- 2100 Paramont Way
- 3144 La Costa Ln
- 1933 Lifetime Dr
- 2021 Ellison Dr
- 2533 Walnut Park Dr
- 2541 Walnut Park Dr
- 2520 Manor Oak Dr
- 2529 Walnut Park Dr
- 2516 Manor Oak Dr
- 2524 Manor Oak Dr
- 2545 Walnut Park Dr
- 2540 Walnut Park Dr
- 2536 Walnut Park Dr
- 2525 Walnut Park Dr
- 2528 Manor Oak Dr
- 2532 Walnut Park Dr
- 2112 Walnut Haven Dr
- 2508 Manor Oak Dr
- 2528 Walnut Park Dr
- 2108 Walnut Haven Dr
- 2521 Walnut Park Dr
- 2532 Manor Oak Dr
- 2524 Walnut Park Dr
- 2541 Black Walnut Dr
Your Personal Tour Guide
Ask me questions while you tour the home.