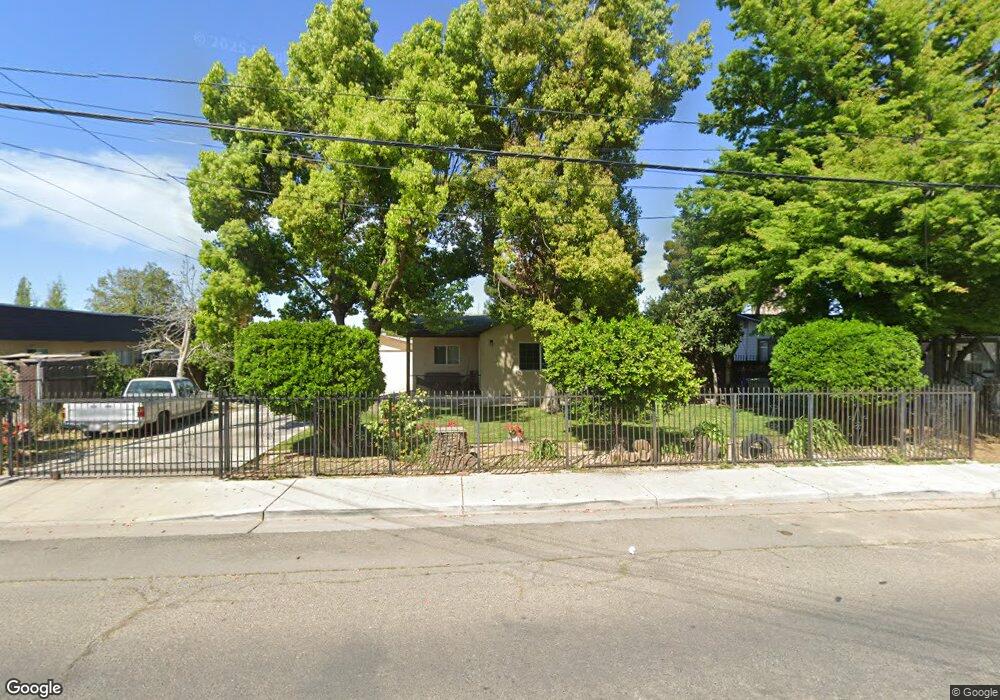
2549 Olive Ave Atwater, CA 95301
Estimated Value: $257,000 - $316,000
2
Beds
1
Bath
830
Sq Ft
$346/Sq Ft
Est. Value
About This Home
This home is located at 2549 Olive Ave, Atwater, CA 95301 and is currently estimated at $287,398, approximately $346 per square foot. 2549 Olive Ave is a home located in Merced County with nearby schools including Aileen Colburn Elementary School, Mitchell Intermediate School, and Atwater High School.
Ownership History
Date
Name
Owned For
Owner Type
Purchase Details
Closed on
Jul 20, 2009
Sold by
Hsbc Bank Usa National Association
Bought by
Quezada Jesus and Quezada Leticia
Current Estimated Value
Purchase Details
Closed on
Feb 25, 2009
Sold by
Martin Victor Hugo
Bought by
Hsbc Bank Usa National Association
Purchase Details
Closed on
Apr 13, 2006
Sold by
Lewis Sophia C
Bought by
Martin Victor Hugo
Home Financials for this Owner
Home Financials are based on the most recent Mortgage that was taken out on this home.
Original Mortgage
$180,000
Interest Rate
7.75%
Mortgage Type
Purchase Money Mortgage
Purchase Details
Closed on
Oct 7, 2004
Sold by
Shultz Doug
Bought by
Lewis Sophia C
Home Financials for this Owner
Home Financials are based on the most recent Mortgage that was taken out on this home.
Original Mortgage
$171,000
Interest Rate
7.7%
Mortgage Type
Purchase Money Mortgage
Create a Home Valuation Report for This Property
The Home Valuation Report is an in-depth analysis detailing your home's value as well as a comparison with similar homes in the area
Home Values in the Area
Average Home Value in this Area
Purchase History
| Date | Buyer | Sale Price | Title Company |
|---|---|---|---|
| Quezada Jesus | $35,000 | First American Title Company | |
| Hsbc Bank Usa National Association | $72,000 | None Available | |
| Martin Victor Hugo | $225,000 | Transcounty Title Company | |
| Lewis Sophia C | $190,000 | Transcounty Title Company |
Source: Public Records
Mortgage History
| Date | Status | Borrower | Loan Amount |
|---|---|---|---|
| Previous Owner | Martin Victor Hugo | $180,000 | |
| Previous Owner | Lewis Sophia C | $171,000 |
Source: Public Records
Tax History
| Year | Tax Paid | Tax Assessment Tax Assessment Total Assessment is a certain percentage of the fair market value that is determined by local assessors to be the total taxable value of land and additions on the property. | Land | Improvement |
|---|---|---|---|---|
| 2025 | $730 | $66,944 | $19,355 | $47,589 |
| 2024 | $730 | $65,632 | $18,976 | $46,656 |
| 2023 | $712 | $64,346 | $18,604 | $45,742 |
| 2022 | $703 | $63,086 | $18,240 | $44,846 |
| 2021 | $704 | $61,850 | $17,883 | $43,967 |
| 2020 | $694 | $61,217 | $17,700 | $43,517 |
| 2019 | $664 | $60,017 | $17,353 | $42,664 |
| 2018 | $647 | $58,841 | $17,013 | $41,828 |
| 2017 | $639 | $57,688 | $16,680 | $41,008 |
| 2016 | $430 | $38,047 | $16,353 | $21,694 |
| 2015 | $425 | $37,477 | $16,108 | $21,369 |
| 2014 | $415 | $36,744 | $15,793 | $20,951 |
Source: Public Records
Map
Nearby Homes
- 1113 Mary Ann Dr
- 2355 Atwater Blvd Unit 18
- 2355 Atwater Blvd Unit 3
- 2355 Atwater Blvd Unit 13
- 2355 Atwater Blvd Unit 28
- 2355 Atwater Blvd Unit 1
- 2355 Atwater Blvd Unit 4
- 2355 Atwater Blvd
- 2294 Olive Ave
- 1940 Truckee Dr
- 1500 Marguerite St
- 1356 Sierra Vista St
- 1883 Sycamore Ave
- 1831 Olive Ave
- 2510 Palora Ave
- 1661 Fir Ave
- 2089 Patriotic Dr
- 1789 Cottonwood Ave
- 1241 6th St
- 3141 Forest Grove Ct
Your Personal Tour Guide
Ask me questions while you tour the home.