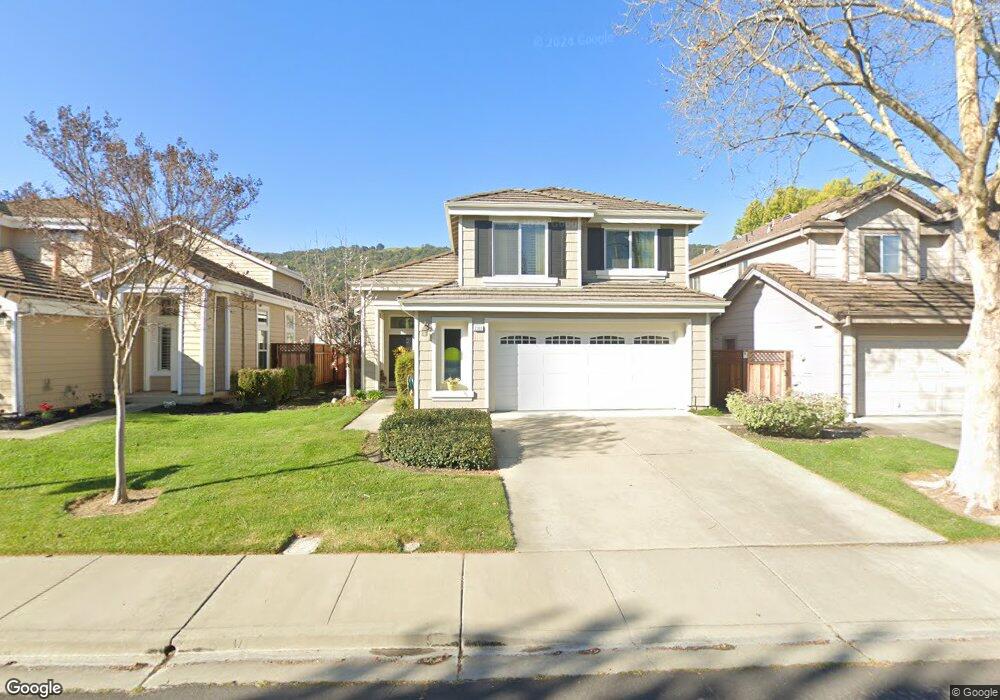
2560 Tapestry Way Pleasanton, CA 94566
Foothill-Pleasanton NeighborhoodEstimated Value: $1,456,000 - $1,610,000
3
Beds
3
Baths
1,838
Sq Ft
$842/Sq Ft
Est. Value
About This Home
This home is located at 2560 Tapestry Way, Pleasanton, CA 94566 and is currently estimated at $1,546,960, approximately $841 per square foot. 2560 Tapestry Way is a home located in Alameda County with nearby schools including Lydiksen Elementary School, Thomas S. Hart Middle School, and Foothill High School.
Ownership History
Date
Name
Owned For
Owner Type
Purchase Details
Closed on
Dec 31, 2018
Sold by
Eastburn Mildred Leonora and The Lindsey Dewitt Eastburn An
Bought by
Eastburn Mildred Leonora and The Mildred Leonora Eastburn S
Current Estimated Value
Purchase Details
Closed on
Jul 28, 2018
Sold by
Eastburn Lindsey D and Eastburn Milly
Bought by
Eastburn Lindsey Dewitt and Eastburn Mildred Leonora
Purchase Details
Closed on
Dec 17, 1993
Sold by
A M Homes
Bought by
Eastburn Lindsey D and Eastburn Milly
Home Financials for this Owner
Home Financials are based on the most recent Mortgage that was taken out on this home.
Original Mortgage
$244,150
Interest Rate
3.75%
Create a Home Valuation Report for This Property
The Home Valuation Report is an in-depth analysis detailing your home's value as well as a comparison with similar homes in the area
Home Values in the Area
Average Home Value in this Area
Purchase History
| Date | Buyer | Sale Price | Title Company |
|---|---|---|---|
| Eastburn Mildred Leonora | -- | None Available | |
| Eastburn Lindsey Dewitt | -- | None Available | |
| Eastburn Lindsey D | $271,500 | First American Title |
Source: Public Records
Mortgage History
| Date | Status | Borrower | Loan Amount |
|---|---|---|---|
| Closed | Eastburn Lindsey D | $244,150 |
Source: Public Records
Tax History Compared to Growth
Tax History
| Year | Tax Paid | Tax Assessment Tax Assessment Total Assessment is a certain percentage of the fair market value that is determined by local assessors to be the total taxable value of land and additions on the property. | Land | Improvement |
|---|---|---|---|---|
| 2025 | $5,569 | $454,101 | $135,968 | $325,133 |
| 2024 | $5,569 | $445,061 | $133,302 | $318,759 |
| 2023 | $5,506 | $443,197 | $130,688 | $312,509 |
| 2022 | $5,231 | $427,508 | $128,126 | $306,382 |
| 2021 | $5,102 | $418,989 | $125,614 | $300,375 |
| 2020 | $5,040 | $421,621 | $124,326 | $297,295 |
| 2019 | $5,095 | $413,354 | $121,888 | $291,466 |
| 2018 | $4,997 | $405,251 | $119,499 | $285,752 |
| 2017 | $4,876 | $397,307 | $117,156 | $280,151 |
| 2016 | $4,518 | $389,518 | $114,860 | $274,658 |
| 2015 | $4,438 | $383,669 | $113,135 | $270,534 |
| 2014 | $4,510 | $376,154 | $110,919 | $265,235 |
Source: Public Records
Map
Nearby Homes
- 1380 Brookline Loop
- 11 Foothill Ln
- 2004 W Lagoon Rd
- 1360 Brookline Loop
- 6686 Via San Blas
- 3338 Marsh Hawk Ct
- 1525 Whispering Oaks Way
- 2122 Arroyo Ct Unit 3
- 2178 Inverness Ct
- 1612 Laguna Hills Ln
- 5995 Via Del Cielo
- 3162 Paseo Robles
- 7297 Huntswood Ct
- 6083 Corte Montanas
- 1225 Royal Creek Ct
- 6056 Corte Encinas
- 3636 Shenandoah Ct
- 2109 Black Oak Ct
- 5988 Corte Cerritos
- 3984 Foothill Rd
- 2556 Tapestry Way
- 2564 Tapestry Way
- 2552 Tapestry Way
- 2568 Tapestry Way
- 2387 Meadowlark Dr
- 2383 Meadowlark Dr
- 2391 Meadowlark Dr
- 2548 Tapestry Way
- 2572 Tapestry Way
- 2379 Meadowlark Dr
- 2395 Meadowlark Dr
- 2399 Meadowlark Dr
- 2375 Meadowlark Dr
- 2544 Tapestry Way
- 2371 Meadowlark Dr
- 2386 Meadowlark Dr
- 2367 Meadowlark Dr
- 2536 Tapestry Way
- 2398 Meadowlark Dr
- 2382 Meadowlark Dr