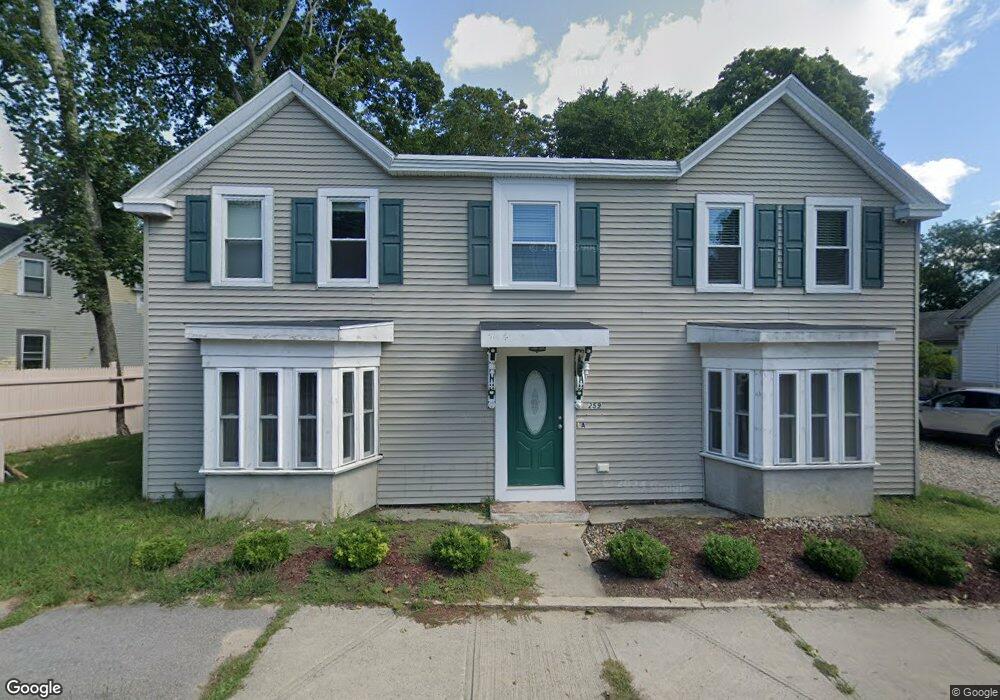
259 High St Wareham, MA 02571
Wareham Center NeighborhoodEstimated Value: $376,000 - $681,000
4
Beds
2
Baths
2,080
Sq Ft
$248/Sq Ft
Est. Value
About This Home
This home is located at 259 High St, Wareham, MA 02571 and is currently estimated at $516,826, approximately $248 per square foot. 259 High St is a home located in Plymouth County with nearby schools including Tabor Academy.
Ownership History
Date
Name
Owned For
Owner Type
Purchase Details
Closed on
Jun 30, 2021
Sold by
Keating John F
Bought by
259 High Street Llc
Current Estimated Value
Purchase Details
Closed on
Jun 21, 2018
Sold by
Hatch Sandra A and Citizens Bank Na
Bought by
Keating John F
Purchase Details
Closed on
Jul 10, 2000
Sold by
Early George F and Early Elda
Bought by
Hatch Sandra A
Purchase Details
Closed on
Apr 21, 1995
Sold by
Ge Capital Mtg Svc Inc
Bought by
Early George F and Early Elda
Purchase Details
Closed on
Sep 9, 1994
Sold by
Cowell Ann C
Bought by
Ge Capital Mtg Svcs
Create a Home Valuation Report for This Property
The Home Valuation Report is an in-depth analysis detailing your home's value as well as a comparison with similar homes in the area
Home Values in the Area
Average Home Value in this Area
Purchase History
| Date | Buyer | Sale Price | Title Company |
|---|---|---|---|
| 259 High Street Llc | -- | None Available | |
| 259 High Street Llc | -- | None Available | |
| Keating John F | $145,000 | -- | |
| Keating John F | $145,000 | -- | |
| Hatch Sandra A | $100,000 | -- | |
| Hatch Sandra A | $100,000 | -- | |
| Early George F | $20,000 | -- | |
| Early George F | $20,000 | -- | |
| Ge Capital Mtg Svcs | $68,432 | -- | |
| Ge Capital Mtg Svcs | $68,432 | -- |
Source: Public Records
Mortgage History
| Date | Status | Borrower | Loan Amount |
|---|---|---|---|
| Previous Owner | Ge Capital Mtg Svcs | $158,000 | |
| Previous Owner | Ge Capital Mtg Svcs | $25,000 |
Source: Public Records
Tax History
| Year | Tax Paid | Tax Assessment Tax Assessment Total Assessment is a certain percentage of the fair market value that is determined by local assessors to be the total taxable value of land and additions on the property. | Land | Improvement |
|---|---|---|---|---|
| 2025 | $4,431 | $425,200 | $101,600 | $323,600 |
| 2024 | $4,535 | $403,800 | $77,300 | $326,500 |
| 2023 | $4,493 | $353,800 | $70,300 | $283,500 |
| 2022 | $4,493 | $340,900 | $70,300 | $270,600 |
| 2021 | $2,823 | $209,900 | $70,300 | $139,600 |
| 2020 | $2,783 | $209,900 | $70,300 | $139,600 |
| 2019 | $2,677 | $201,400 | $63,400 | $138,000 |
| 2018 | $2,547 | $186,900 | $63,400 | $123,500 |
| 2017 | $2,449 | $182,100 | $63,400 | $118,700 |
| 2016 | $2,288 | $169,100 | $60,100 | $109,000 |
| 2015 | $2,337 | $178,800 | $60,100 | $118,700 |
| 2014 | $2,346 | $182,600 | $60,100 | $122,500 |
Source: Public Records
Map
Nearby Homes
- 437 Main St
- 110 Mayflower Ridge Dr
- 10 Longmeadow Dr
- 6 Bourne Terrace
- 7 Maud Palmer Dr
- 233 Marion Rd
- 2645 Cranberry Hwy Unit A
- 12 Oakdale St
- 17 Station St
- 19 Station St
- 15 14th Ave
- 9 Woodville Way
- 2697 Cranberry Hwy Unit 21
- 1 Nimrod Way
- 2711 Cranberry Hwy
- 15 Broadmarsh Ave
- 10 Oak St
- 189 Pine View Terrace
- 6 Allen Ave
- 20 Grant St
Your Personal Tour Guide
Ask me questions while you tour the home.