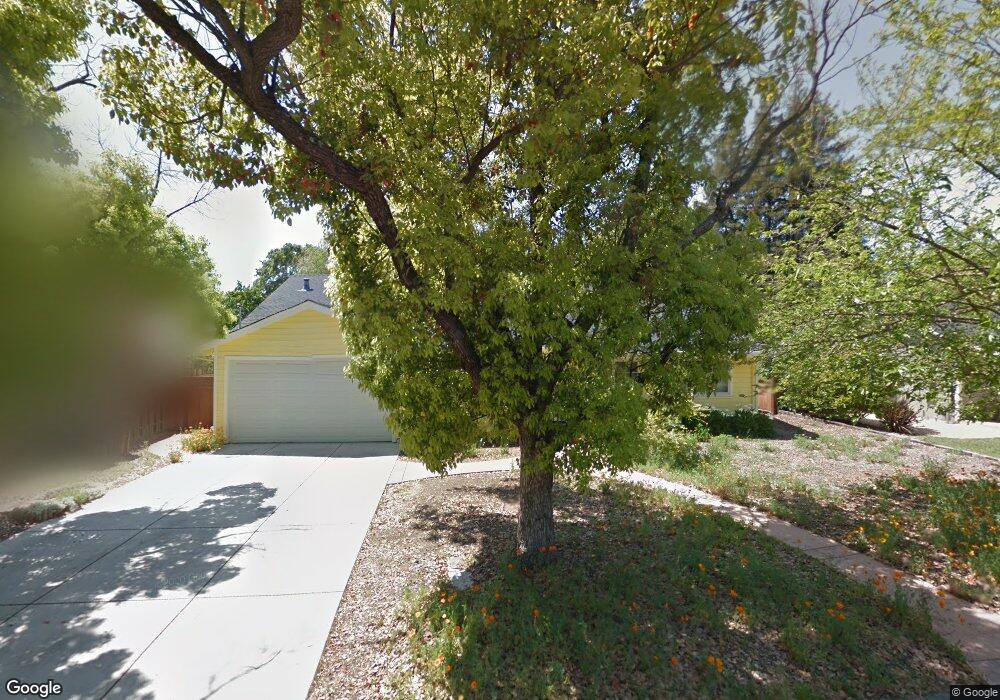
26 Elliot Dr Pleasant Hill, CA 94523
Estimated Value: $1,230,000 - $1,640,000
5
Beds
3
Baths
2,603
Sq Ft
$559/Sq Ft
Est. Value
About This Home
This home is located at 26 Elliot Dr, Pleasant Hill, CA 94523 and is currently estimated at $1,456,033, approximately $559 per square foot. 26 Elliot Dr is a home located in Contra Costa County with nearby schools including Pleasant Hill Elementary School, Pleasant Hill Middle School, and College Park High School.
Ownership History
Date
Name
Owned For
Owner Type
Purchase Details
Closed on
Dec 19, 2015
Sold by
Shin Kashiyama Erika
Bought by
Shin Kashlyama Erika
Current Estimated Value
Purchase Details
Closed on
Dec 9, 2015
Sold by
Kashiyama Takuji and Shin Kashiyama Erika
Bought by
Kashiyama Takuji and Shin Kashlyama Erika
Purchase Details
Closed on
Nov 17, 2012
Sold by
Kashiyama Takuji and Shin Kashiyama Erika
Bought by
Kashiyama Takuji
Purchase Details
Closed on
Aug 16, 1999
Sold by
Shepherd Ada C Living Trust
Bought by
Kashiyama Takuji and Shin Kashiyama Erika
Home Financials for this Owner
Home Financials are based on the most recent Mortgage that was taken out on this home.
Original Mortgage
$280,000
Interest Rate
7.75%
Mortgage Type
Purchase Money Mortgage
Purchase Details
Closed on
Jun 21, 1995
Sold by
Shepherd Ada C
Bought by
Shepherd Ada C
Create a Home Valuation Report for This Property
The Home Valuation Report is an in-depth analysis detailing your home's value as well as a comparison with similar homes in the area
Home Values in the Area
Average Home Value in this Area
Purchase History
| Date | Buyer | Sale Price | Title Company |
|---|---|---|---|
| Shin Kashlyama Erika | -- | None Available | |
| Shin Kashiyama Erika | -- | None Available | |
| Kashiyama Takuji | -- | None Available | |
| Kashiyama Takuji | -- | None Available | |
| Kashiyama Takuji | $320,000 | Old Republic Title Company | |
| Shepherd Ada C | -- | -- |
Source: Public Records
Mortgage History
| Date | Status | Borrower | Loan Amount |
|---|---|---|---|
| Previous Owner | Kashiyama Takuji | $280,000 |
Source: Public Records
Tax History Compared to Growth
Tax History
| Year | Tax Paid | Tax Assessment Tax Assessment Total Assessment is a certain percentage of the fair market value that is determined by local assessors to be the total taxable value of land and additions on the property. | Land | Improvement |
|---|---|---|---|---|
| 2025 | $8,168 | $672,610 | $268,959 | $403,651 |
| 2024 | $8,033 | $659,423 | $263,686 | $395,737 |
| 2023 | $8,033 | $646,494 | $258,516 | $387,978 |
| 2022 | $7,965 | $633,819 | $253,448 | $380,371 |
| 2021 | $7,793 | $621,392 | $248,479 | $372,913 |
| 2019 | $7,630 | $602,963 | $241,110 | $361,853 |
| 2018 | $7,442 | $591,141 | $236,383 | $354,758 |
| 2017 | $7,220 | $579,551 | $231,749 | $347,802 |
| 2016 | $7,053 | $568,188 | $227,205 | $340,983 |
| 2015 | $7,002 | $559,655 | $223,793 | $335,862 |
| 2014 | -- | $548,693 | $219,410 | $329,283 |
Source: Public Records
Map
Nearby Homes
- 25 Brandon Rd
- 312 Soule Ave
- 256 Douglas Ln
- 1933 Oak Park Blvd
- 53 Monte Cresta Ave
- 2422 Pleasant Hill Rd Unit 6
- 105 Laurel Oak Dr
- 1912 Vicki Ln
- 589 Maureen Ln
- 808 Grayson Rd
- 309 Sunset Rd
- 190 Cleaveland Rd Unit 12
- 170 Cleaveland Rd
- 26 Warhol Way
- 406 Ivy Ln
- 11 Forest Hills Ct
- 3093 Diablo View Rd
- 1919 Helen Rd Unit 2
- 1007 Pleasant Valley Dr
- 156 Haslemere Ct Unit 1