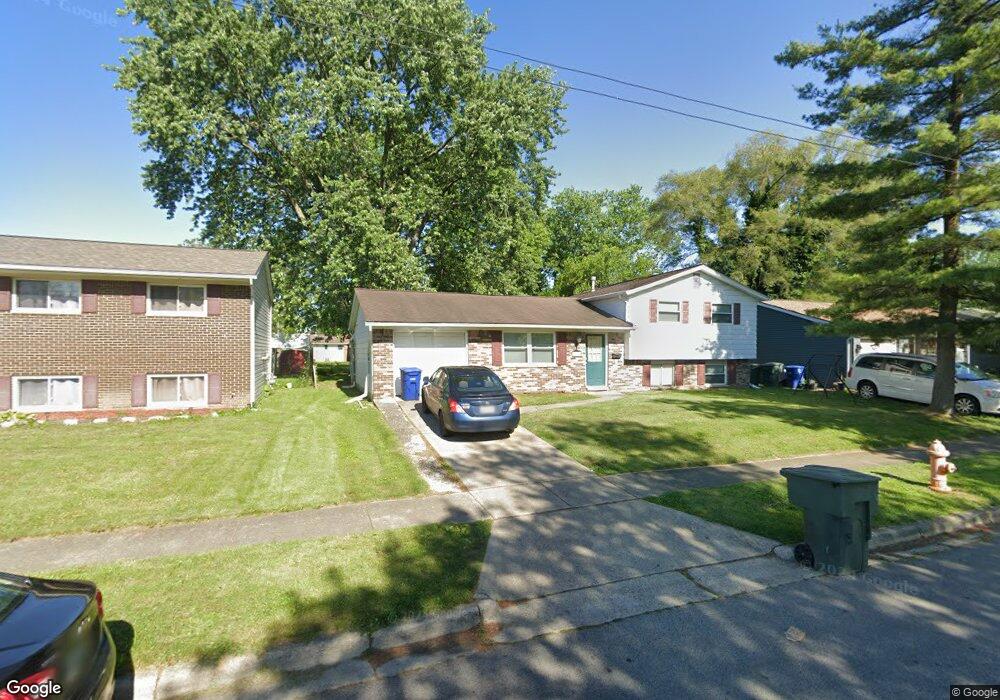
2608 Denmark Rd Columbus, OH 43232
Walnut Heights NeighborhoodEstimated Value: $209,660 - $239,000
3
Beds
2
Baths
1,405
Sq Ft
$157/Sq Ft
Est. Value
About This Home
This home is located at 2608 Denmark Rd, Columbus, OH 43232 and is currently estimated at $221,165, approximately $157 per square foot. 2608 Denmark Rd is a home located in Franklin County with nearby schools including Liberty Elementary School, Yorktown Middle School, and Independence High School.
Ownership History
Date
Name
Owned For
Owner Type
Purchase Details
Closed on
Aug 18, 2011
Sold by
Martin Chris and Martin Christina L
Bought by
E2 Homes Solutions Group Llc
Current Estimated Value
Home Financials for this Owner
Home Financials are based on the most recent Mortgage that was taken out on this home.
Original Mortgage
$101,250
Outstanding Balance
$5,074
Interest Rate
3.7%
Mortgage Type
New Conventional
Estimated Equity
$216,091
Purchase Details
Closed on
Feb 4, 2011
Sold by
Hampton Donjuan L and Hampton Nakina R
Bought by
Martin Chris
Purchase Details
Closed on
Jan 29, 2007
Sold by
Wehler Carleen A and Wehler Christopher
Bought by
Hampton Donjuan L and Hampton Nakina R
Home Financials for this Owner
Home Financials are based on the most recent Mortgage that was taken out on this home.
Original Mortgage
$109,100
Interest Rate
6.19%
Mortgage Type
Purchase Money Mortgage
Purchase Details
Closed on
Feb 2, 1990
Create a Home Valuation Report for This Property
The Home Valuation Report is an in-depth analysis detailing your home's value as well as a comparison with similar homes in the area
Home Values in the Area
Average Home Value in this Area
Purchase History
| Date | Buyer | Sale Price | Title Company |
|---|---|---|---|
| E2 Homes Solutions Group Llc | -- | Services Tit | |
| Martin Chris | $45,000 | Real Living | |
| Hampton Donjuan L | $112,500 | Attorney | |
| -- | -- | -- |
Source: Public Records
Mortgage History
| Date | Status | Borrower | Loan Amount |
|---|---|---|---|
| Open | E2 Homes Solutions Group Llc | $101,250 | |
| Previous Owner | Hampton Donjuan L | $109,100 |
Source: Public Records
Tax History
| Year | Tax Paid | Tax Assessment Tax Assessment Total Assessment is a certain percentage of the fair market value that is determined by local assessors to be the total taxable value of land and additions on the property. | Land | Improvement |
|---|---|---|---|---|
| 2025 | $2,326 | $50,760 | $18,240 | $32,520 |
| 2024 | $2,326 | $50,760 | $18,240 | $32,520 |
| 2023 | $2,947 | $65,100 | $18,235 | $46,865 |
| 2022 | $1,228 | $23,110 | $6,830 | $16,280 |
| 2021 | $1,230 | $23,110 | $6,830 | $16,280 |
| 2020 | $1,232 | $23,110 | $6,830 | $16,280 |
| 2019 | $1,198 | $19,260 | $5,710 | $13,550 |
| 2018 | $598 | $19,260 | $5,710 | $13,550 |
| 2017 | $1,197 | $19,260 | $5,710 | $13,550 |
| 2016 | $1,046 | $15,400 | $4,690 | $10,710 |
| 2015 | $476 | $15,400 | $4,690 | $10,710 |
| 2014 | $1,131 | $18,240 | $4,690 | $13,550 |
| 2013 | $620 | $20,265 | $5,215 | $15,050 |
Source: Public Records
Map
Nearby Homes
- 2651 Brownfield Rd
- 2706 Moundcrest St
- 5137 Holbrook Dr
- 5114 Carbondale Dr
- 5123 Jameson Dr
- 5144 Botsford Dr
- 2730 Raphael Dr
- 2700 Raphael Dr
- 2900 Gentry Ln
- 5326 Adderley Ave
- 5414 Paladim Rd
- 2736 Barrows Rd
- 2744 Barrows Rd
- 5290 Quincy Dr
- 5373 Spire Ln
- 2998 Osgood Rd E
- 2908 Renfro Rd
- 0 Noe Bixby Rd
- 2336 Noe Bixby Rd
- 2348 Noe Bixby Rd
- 2600 Denmark Rd
- 2616 Denmark Rd
- 2626 Denmark Rd
- 5265 Carbondale Dr
- 5267 Carbondale Dr
- 2611 Brownfield Rd
- 2605 Brownfield Rd
- 2607 Denmark Rd
- 2615 Denmark Rd
- 2599 Denmark Rd
- 2619 Brownfield Rd
- 5269 Carbondale Dr
- 2632 Denmark Rd
- 2627 Denmark Rd
- 5241 Carbondale Dr
- 2627 Brownfield Rd
- 2593 Brownfield Rd
- 2633 Denmark Rd
- 2640 Denmark Rd
- 5266 Carbondale Dr
Your Personal Tour Guide
Ask me questions while you tour the home.