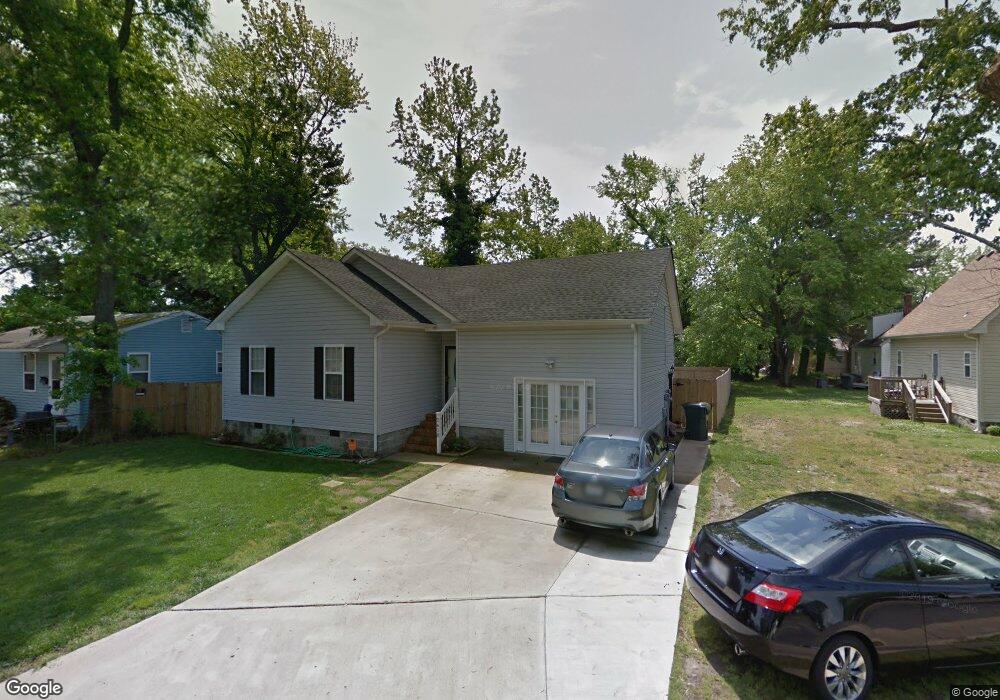
2610 Shell Rd Hampton, VA 23661
Wythe NeighborhoodEstimated Value: $260,000 - $321,000
4
Beds
2
Baths
1,847
Sq Ft
$162/Sq Ft
Est. Value
About This Home
This home is located at 2610 Shell Rd, Hampton, VA 23661 and is currently estimated at $298,552, approximately $161 per square foot. 2610 Shell Rd is a home located in Hampton City with nearby schools including Hunter B. Andrews PK-8 School, C. Alton Lindsay Middle School, and Hampton High School.
Ownership History
Date
Name
Owned For
Owner Type
Purchase Details
Closed on
Sep 26, 2007
Sold by
Lawrence & Sons Inc
Bought by
Barrett Terry A and Jackson,Aretha L
Current Estimated Value
Home Financials for this Owner
Home Financials are based on the most recent Mortgage that was taken out on this home.
Original Mortgage
$250,000
Outstanding Balance
$159,651
Interest Rate
6.65%
Mortgage Type
New Conventional
Estimated Equity
$138,901
Create a Home Valuation Report for This Property
The Home Valuation Report is an in-depth analysis detailing your home's value as well as a comparison with similar homes in the area
Home Values in the Area
Average Home Value in this Area
Purchase History
| Date | Buyer | Sale Price | Title Company |
|---|---|---|---|
| Barrett Terry A | $250,000 | -- |
Source: Public Records
Mortgage History
| Date | Status | Borrower | Loan Amount |
|---|---|---|---|
| Open | Barrett Terry A | $250,000 |
Source: Public Records
Tax History
| Year | Tax Paid | Tax Assessment Tax Assessment Total Assessment is a certain percentage of the fair market value that is determined by local assessors to be the total taxable value of land and additions on the property. | Land | Improvement |
|---|---|---|---|---|
| 2025 | $3,677 | $309,400 | $45,000 | $264,400 |
| 2024 | $3,531 | $307,000 | $45,000 | $262,000 |
| 2023 | $3,251 | $280,300 | $45,000 | $235,300 |
| 2022 | $3,047 | $258,200 | $40,000 | $218,200 |
| 2021 | $2,853 | $219,600 | $34,000 | $185,600 |
| 2020 | $2,673 | $215,600 | $32,000 | $183,600 |
| 2019 | $2,433 | $196,200 | $31,000 | $165,200 |
| 2018 | $2,527 | $196,200 | $31,000 | $165,200 |
| 2017 | $2,527 | $0 | $0 | $0 |
| 2016 | $2,527 | $196,200 | $0 | $0 |
| 2015 | $2,527 | $0 | $0 | $0 |
| 2014 | $2,517 | $196,200 | $31,000 | $165,200 |
Source: Public Records
Map
Nearby Homes
Your Personal Tour Guide
Ask me questions while you tour the home.