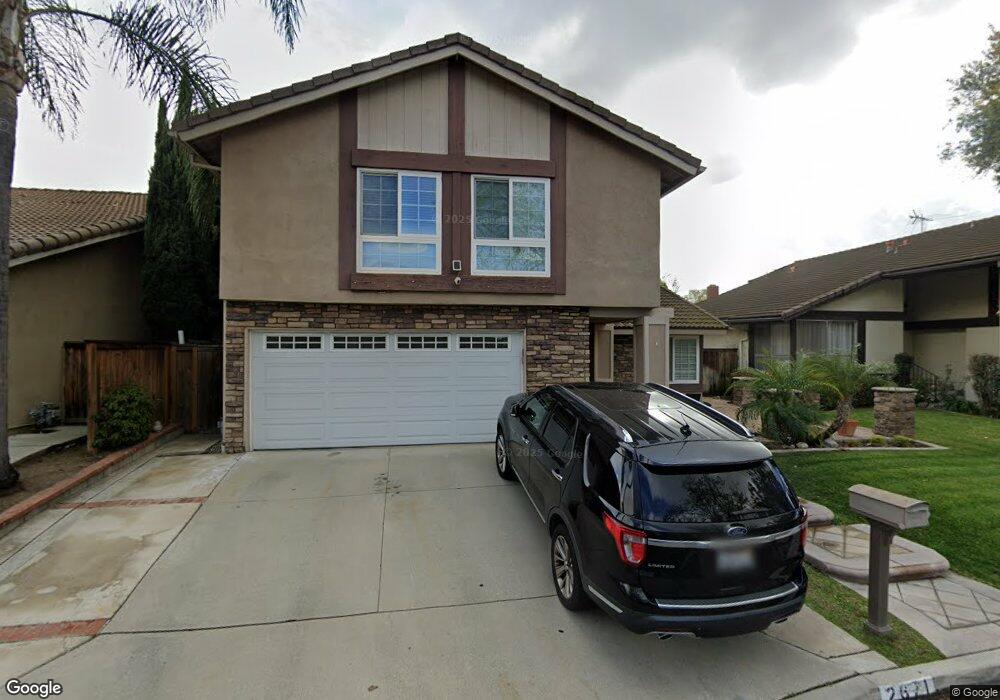
2671 Foxborough Place Fullerton, CA 92833
Sunny Hills NeighborhoodEstimated Value: $1,176,000 - $1,393,000
4
Beds
3
Baths
2,342
Sq Ft
$559/Sq Ft
Est. Value
About This Home
This home is located at 2671 Foxborough Place, Fullerton, CA 92833 and is currently estimated at $1,308,749, approximately $558 per square foot. 2671 Foxborough Place is a home located in Orange County with nearby schools including Fern Drive Elementary School, D. Russell Parks Junior High School, and Sunny Hills High School.
Ownership History
Date
Name
Owned For
Owner Type
Purchase Details
Closed on
Apr 23, 2007
Sold by
Farias Monica Ann and Bennett Aurelia Cota
Bought by
Farias Richard and Farias Monica Ann
Current Estimated Value
Purchase Details
Closed on
Jan 5, 1999
Sold by
Cota Bennett Aurelia and Cota Ann Monica
Bought by
Farias Monica Ann and Bennett Aurelia Cota
Home Financials for this Owner
Home Financials are based on the most recent Mortgage that was taken out on this home.
Original Mortgage
$187,000
Interest Rate
6.75%
Purchase Details
Closed on
Dec 12, 1995
Sold by
Bennett Aurelia Cota and Farias Richard C
Bought by
Bennett Aurelia Cota and Farias Monica Ann
Home Financials for this Owner
Home Financials are based on the most recent Mortgage that was taken out on this home.
Original Mortgage
$160,000
Interest Rate
7.37%
Create a Home Valuation Report for This Property
The Home Valuation Report is an in-depth analysis detailing your home's value as well as a comparison with similar homes in the area
Home Values in the Area
Average Home Value in this Area
Purchase History
| Date | Buyer | Sale Price | Title Company |
|---|---|---|---|
| Farias Richard | -- | First American Title | |
| Farias Monica Ann | -- | Chicago Title Co | |
| Bennett Aurelia Cota | -- | Continental Lawyers Title Co |
Source: Public Records
Mortgage History
| Date | Status | Borrower | Loan Amount |
|---|---|---|---|
| Closed | Farias Monica Ann | $187,000 | |
| Closed | Bennett Aurelia Cota | $160,000 |
Source: Public Records
Tax History Compared to Growth
Tax History
| Year | Tax Paid | Tax Assessment Tax Assessment Total Assessment is a certain percentage of the fair market value that is determined by local assessors to be the total taxable value of land and additions on the property. | Land | Improvement |
|---|---|---|---|---|
| 2025 | $4,595 | $409,063 | $162,587 | $246,476 |
| 2024 | $4,595 | $401,043 | $159,399 | $241,644 |
| 2023 | $4,482 | $393,180 | $156,274 | $236,906 |
| 2022 | $4,448 | $385,471 | $153,210 | $232,261 |
| 2021 | $4,371 | $377,913 | $150,206 | $227,707 |
| 2020 | $4,345 | $374,038 | $148,665 | $225,373 |
| 2019 | $4,234 | $366,704 | $145,750 | $220,954 |
| 2018 | $4,169 | $359,514 | $142,892 | $216,622 |
| 2017 | $4,099 | $352,465 | $140,090 | $212,375 |
| 2016 | $4,014 | $345,554 | $137,343 | $208,211 |
| 2015 | $3,902 | $340,364 | $135,280 | $205,084 |
| 2014 | $3,789 | $333,697 | $132,630 | $201,067 |
Source: Public Records
Map
Nearby Homes
- 900 Ashton Place
- 2523 Cypress Point Dr
- 2410 Plaza de Vista
- 6 Tidewater Cove
- 1108 Jewett Dr Unit 23
- 433 435 N Basque
- 86 Lakeside Dr
- 2517 Greenhill Dr
- 109 S Vermont Ave
- 134 S Pritchard Ave
- 9 Coveside Ct
- 101 Turner Ave
- 1617 Via Linda Unit 17
- 2006 Hetebrink St
- 11 Travis Rd
- 3604 W Valencia Dr
- 4943 Saint Andrews Ave
- 2009 W Las Lanas Ln
- 4900 Lincolnshire Ave
- 2307 Camino Recondito
- 2677 Foxborough Place
- 2665 Foxborough Place
- 2657 Foxborough Place
- 2683 Foxborough Place
- 2693 Foxborough Place
- 2651 Foxborough Place
- 2699 Foxborough Place
- 2662 Foxborough Place
- 2668 Foxborough Place
- 2674 Foxborough Place
- 2656 Foxborough Place
- 2680 Foxborough Place
- 2686 Foxborough Place
- 2650 Foxborough Place
- 2631 Cypress Point Dr
- 2692 Foxborough Place
- 2627 Cypress Point Dr
- 2633 Cypress Point Dr
- 2635 Cypress Point Dr
- 2625 Cypress Point Dr