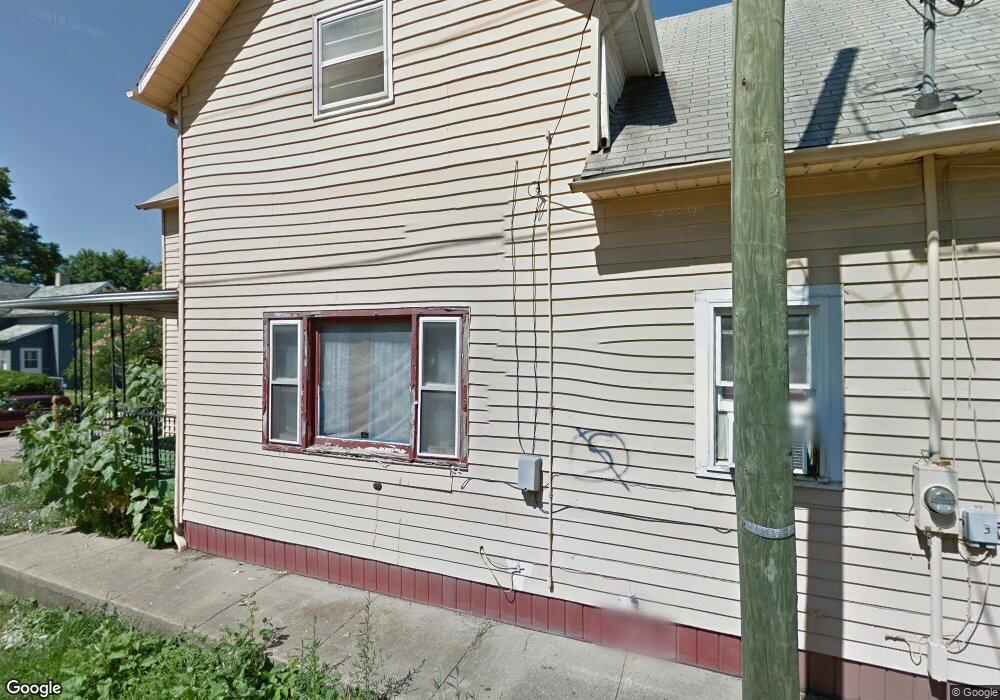
272 Iowa St Indianapolis, IN 46225
Bates-Hendricks NeighborhoodEstimated Value: $244,000 - $380,000
4
Beds
2
Baths
2,941
Sq Ft
$100/Sq Ft
Est. Value
About This Home
This home is located at 272 Iowa St, Indianapolis, IN 46225 and is currently estimated at $295,296, approximately $100 per square foot. 272 Iowa St is a home located in Marion County with nearby schools including Eleanor Skillen School No. 34, Ralph Waldo Emerson School 58, and James A. Garfield School 31.
Ownership History
Date
Name
Owned For
Owner Type
Purchase Details
Closed on
Sep 26, 2006
Sold by
Morrison Jeannie L and Morrison Jeannie
Bought by
Shuffitt Frank M and Shuffitt Bonita
Current Estimated Value
Home Financials for this Owner
Home Financials are based on the most recent Mortgage that was taken out on this home.
Original Mortgage
$41,225
Outstanding Balance
$24,641
Interest Rate
6.49%
Mortgage Type
New Conventional
Estimated Equity
$270,655
Create a Home Valuation Report for This Property
The Home Valuation Report is an in-depth analysis detailing your home's value as well as a comparison with similar homes in the area
Home Values in the Area
Average Home Value in this Area
Purchase History
| Date | Buyer | Sale Price | Title Company |
|---|---|---|---|
| Shuffitt Frank M | -- | None Available |
Source: Public Records
Mortgage History
| Date | Status | Borrower | Loan Amount |
|---|---|---|---|
| Open | Shuffitt Frank M | $41,225 |
Source: Public Records
Tax History Compared to Growth
Tax History
| Year | Tax Paid | Tax Assessment Tax Assessment Total Assessment is a certain percentage of the fair market value that is determined by local assessors to be the total taxable value of land and additions on the property. | Land | Improvement |
|---|---|---|---|---|
| 2024 | $1,132 | $115,800 | $12,700 | $103,100 |
| 2023 | $1,132 | $110,900 | $12,700 | $98,200 |
| 2022 | $992 | $104,900 | $12,700 | $92,200 |
| 2021 | $992 | $96,700 | $12,700 | $84,000 |
| 2020 | $679 | $85,700 | $12,700 | $73,000 |
| 2019 | $1,174 | $111,000 | $3,700 | $107,300 |
| 2018 | $1,033 | $97,300 | $3,700 | $93,600 |
| 2017 | $647 | $81,700 | $3,700 | $78,000 |
| 2016 | $556 | $81,700 | $3,700 | $78,000 |
| 2014 | $464 | $75,000 | $3,700 | $71,300 |
| 2013 | $454 | $73,300 | $3,700 | $69,600 |
Source: Public Records
Map
Nearby Homes