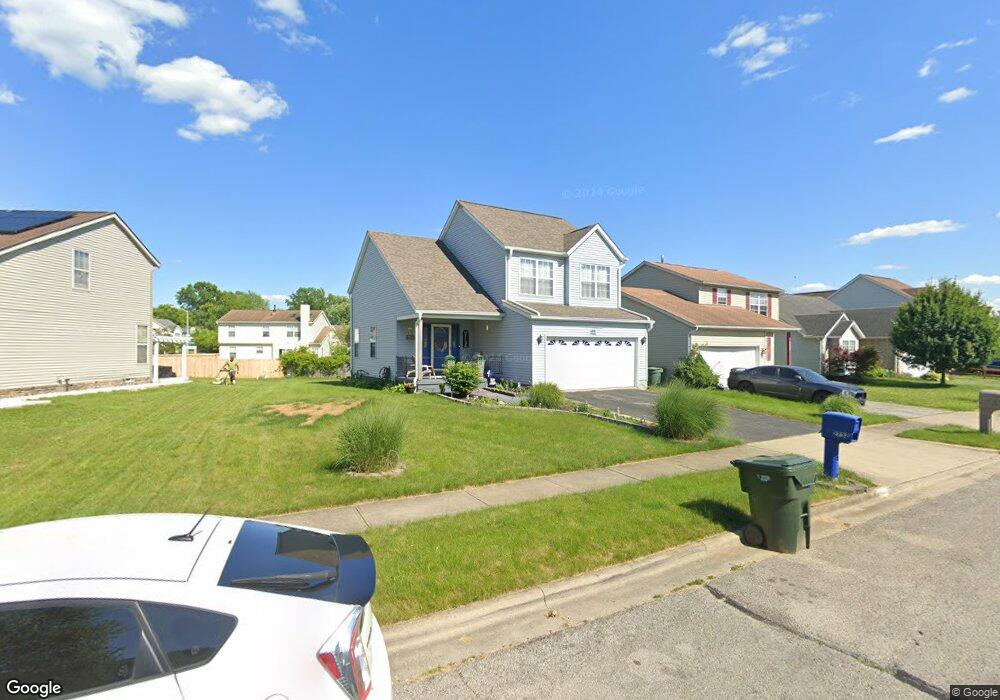
2732 Beal Dr Columbus, OH 43232
Walnut Heights NeighborhoodEstimated Value: $256,969 - $283,000
3
Beds
3
Baths
1,450
Sq Ft
$186/Sq Ft
Est. Value
About This Home
This home is located at 2732 Beal Dr, Columbus, OH 43232 and is currently estimated at $270,242, approximately $186 per square foot. 2732 Beal Dr is a home located in Franklin County with nearby schools including Liberty Elementary School, Yorktown Middle School, and Independence High School.
Ownership History
Date
Name
Owned For
Owner Type
Purchase Details
Closed on
Aug 15, 2007
Sold by
Elmadani Afaf M and Khadre Mohammed
Bought by
Mickey Joseph E and Mickey Teresa A
Current Estimated Value
Home Financials for this Owner
Home Financials are based on the most recent Mortgage that was taken out on this home.
Original Mortgage
$129,476
Outstanding Balance
$81,003
Interest Rate
6.79%
Mortgage Type
FHA
Estimated Equity
$189,239
Purchase Details
Closed on
Apr 11, 2001
Sold by
Hud
Bought by
Elmadani Afaf M
Home Financials for this Owner
Home Financials are based on the most recent Mortgage that was taken out on this home.
Original Mortgage
$92,000
Interest Rate
7.05%
Purchase Details
Closed on
Sep 20, 2000
Sold by
Flagstar Bank Fsb
Bought by
Hud
Purchase Details
Closed on
Aug 10, 2000
Sold by
Hitchens Douglas F and Case #99Cve03 2526
Bought by
Flagstar Bank Fsb
Purchase Details
Closed on
Jan 24, 1995
Sold by
Columbus Contractor Co
Bought by
Douglas F Hitchens
Create a Home Valuation Report for This Property
The Home Valuation Report is an in-depth analysis detailing your home's value as well as a comparison with similar homes in the area
Home Values in the Area
Average Home Value in this Area
Purchase History
| Date | Buyer | Sale Price | Title Company |
|---|---|---|---|
| Mickey Joseph E | $129,500 | Apex Title | |
| Elmadani Afaf M | $115,000 | Contract Processing & Title | |
| Hud | -- | -- | |
| Flagstar Bank Fsb | $77,000 | -- | |
| Douglas F Hitchens | $103,050 | -- |
Source: Public Records
Mortgage History
| Date | Status | Borrower | Loan Amount |
|---|---|---|---|
| Open | Mickey Joseph E | $129,476 | |
| Previous Owner | Elmadani Afaf M | $92,000 | |
| Closed | Douglas F Hitchens | -- |
Source: Public Records
Tax History
| Year | Tax Paid | Tax Assessment Tax Assessment Total Assessment is a certain percentage of the fair market value that is determined by local assessors to be the total taxable value of land and additions on the property. | Land | Improvement |
|---|---|---|---|---|
| 2025 | $3,395 | $75,640 | $16,980 | $58,660 |
| 2024 | $3,395 | $75,640 | $16,980 | $58,660 |
| 2023 | $3,351 | $75,640 | $16,980 | $58,660 |
| 2022 | $2,461 | $47,460 | $6,300 | $41,160 |
| 2021 | $2,466 | $47,460 | $6,300 | $41,160 |
| 2020 | $2,469 | $47,460 | $6,300 | $41,160 |
| 2019 | $2,408 | $39,690 | $5,250 | $34,440 |
| 2018 | $2,135 | $39,690 | $5,250 | $34,440 |
| 2017 | $2,406 | $39,690 | $5,250 | $34,440 |
| 2016 | $2,057 | $31,050 | $5,850 | $25,200 |
| 2015 | $1,867 | $31,050 | $5,850 | $25,200 |
| 2014 | $1,872 | $31,050 | $5,850 | $25,200 |
| 2013 | $1,026 | $34,510 | $6,510 | $28,000 |
Source: Public Records
Map
Nearby Homes
- 2736 Barrows Rd
- 2744 Barrows Rd
- 2730 Raphael Dr
- 2700 Raphael Dr
- 2706 Moundcrest St
- 5326 Adderley Ave
- 2651 Brownfield Rd
- 5414 Paladim Rd
- 2900 Gentry Ln
- 2608 Hubbell Rd
- 5882 Abernathy Ln Unit 5882F
- 5137 Holbrook Dr
- 5373 Spire Ln
- 5944 Abernathy Ln
- 5946 Abernathy Ln
- 5960 Abernathy Ln
- 5962 Abernathy Ln
- 5968 Abernathy Ln
- 5970 Abernathy Ln
- 5976 Abernathy Ln
Your Personal Tour Guide
Ask me questions while you tour the home.