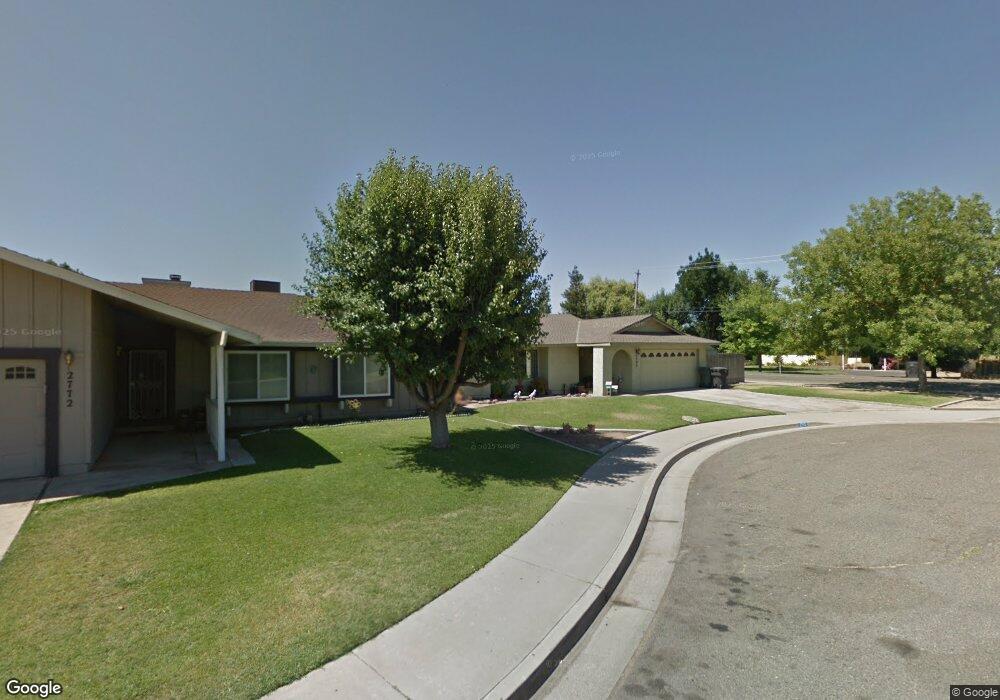
2792 Neplus Ct Atwater, CA 95301
Estimated Value: $369,000 - $377,000
3
Beds
2
Baths
1,306
Sq Ft
$286/Sq Ft
Est. Value
About This Home
This home is located at 2792 Neplus Ct, Atwater, CA 95301 and is currently estimated at $373,162, approximately $285 per square foot. 2792 Neplus Ct is a home located in Merced County with nearby schools including Elmer Wood Elementary School, Mitchell Intermediate School, and Atwater High School.
Ownership History
Date
Name
Owned For
Owner Type
Purchase Details
Closed on
Oct 14, 2020
Sold by
Gilreath Peggy
Bought by
Gilreath Claude E
Current Estimated Value
Home Financials for this Owner
Home Financials are based on the most recent Mortgage that was taken out on this home.
Original Mortgage
$237,316
Outstanding Balance
$211,080
Interest Rate
2.9%
Mortgage Type
New Conventional
Estimated Equity
$162,082
Purchase Details
Closed on
Oct 8, 2020
Sold by
Holt Rodney Lee and Holt Wrenda
Bought by
Holt Joshua and Holt Claudia
Home Financials for this Owner
Home Financials are based on the most recent Mortgage that was taken out on this home.
Original Mortgage
$237,316
Outstanding Balance
$211,080
Interest Rate
2.9%
Mortgage Type
New Conventional
Estimated Equity
$162,082
Purchase Details
Closed on
Jan 4, 2018
Sold by
Mcbride Esther J
Bought by
Holt Rodney Lee and Holt Wrenda
Home Financials for this Owner
Home Financials are based on the most recent Mortgage that was taken out on this home.
Original Mortgage
$139,125
Interest Rate
3.93%
Mortgage Type
New Conventional
Create a Home Valuation Report for This Property
The Home Valuation Report is an in-depth analysis detailing your home's value as well as a comparison with similar homes in the area
Home Values in the Area
Average Home Value in this Area
Purchase History
| Date | Buyer | Sale Price | Title Company |
|---|---|---|---|
| Gilreath Claude E | -- | Transcounty Title Company | |
| Holt Joshua | $250,000 | Transcounty Title Company | |
| Holt Rodney Lee | $185,500 | Transcounty Title Company |
Source: Public Records
Mortgage History
| Date | Status | Borrower | Loan Amount |
|---|---|---|---|
| Open | Gilreath Claude E | $237,316 | |
| Previous Owner | Holt Rodney Lee | $139,125 |
Source: Public Records
Tax History
| Year | Tax Paid | Tax Assessment Tax Assessment Total Assessment is a certain percentage of the fair market value that is determined by local assessors to be the total taxable value of land and additions on the property. | Land | Improvement |
|---|---|---|---|---|
| 2025 | $2,911 | $270,606 | $81,181 | $189,425 |
| 2024 | $2,911 | $265,301 | $79,590 | $185,711 |
| 2023 | $2,826 | $260,100 | $78,030 | $182,070 |
| 2022 | $2,761 | $255,000 | $76,500 | $178,500 |
| 2021 | $2,766 | $250,000 | $75,000 | $175,000 |
| 2020 | $2,139 | $192,994 | $46,818 | $146,176 |
| 2019 | $2,046 | $189,210 | $45,900 | $143,310 |
| 2018 | $1,246 | $122,152 | $37,740 | $84,412 |
| 2017 | $1,229 | $119,757 | $37,000 | $82,757 |
| 2016 | $1,208 | $117,410 | $36,275 | $81,135 |
| 2015 | $1,193 | $115,648 | $35,731 | $79,917 |
| 2014 | $1,163 | $113,384 | $35,032 | $78,352 |
Source: Public Records
Map
Nearby Homes
- 2762 Neplus Ct
- 3337 Stacey Ct
- 3141 Forest Grove Ct
- 2708 Carmel Ct
- 3408 Carrie Ct
- 2510 Palora Ave
- 3330 Virginia St
- 1113 Mary Ann Dr
- 1561 Riechel Ave
- 0 Grove Ave
- 1527 Underwood Ave
- 2551 7th St
- 6289 Monica Way
- 2355 Atwater Blvd Unit 1
- 2355 Atwater Blvd Unit 18
- 2355 Atwater Blvd Unit 3
- 2355 Atwater Blvd Unit 13
- 2355 Atwater Blvd Unit 28
- 2355 Atwater Blvd Unit 4
- 2355 Atwater Blvd
- 2772 Neplus Ct
- 2791 Mono Way
- 2771 Mono Way
- 2761 Mono Way
- 5351 Orchard Park
- 2793 Neplus Ct
- 2773 Neplus Ct
- 2742 Neplus Ct
- 2741 Mono Way
- 2763 Neplus Ct
- 2790 Mono Way
- 2743 Neplus Ct
- 2770 Mono Way
- 2794 Mission Way
- 2760 Mono Way
- 2774 Mission Way
- 2764 Mission Way
- 2740 Mono Way
- 2722 Emerald Ct
- 2721 Mono Way
Your Personal Tour Guide
Ask me questions while you tour the home.