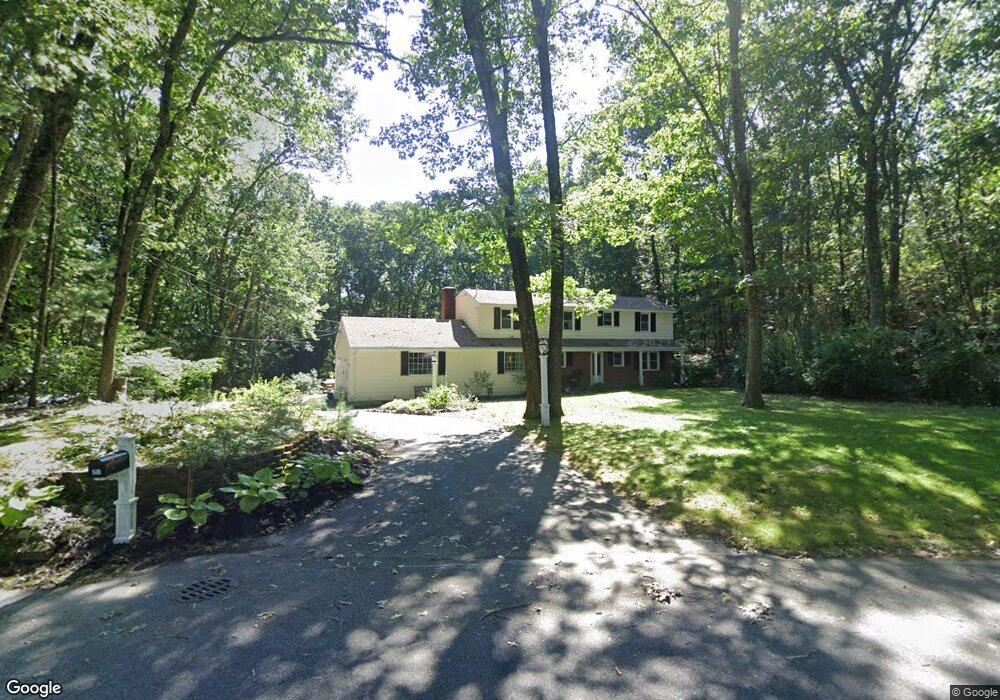
28 Birch Rd Andover, MA 01810
West Andover NeighborhoodEstimated Value: $1,006,000 - $1,193,000
3
Beds
4
Baths
2,469
Sq Ft
$444/Sq Ft
Est. Value
About This Home
This home is located at 28 Birch Rd, Andover, MA 01810 and is currently estimated at $1,096,284, approximately $444 per square foot. 28 Birch Rd is a home located in Essex County with nearby schools including West Elementary School, Andover West Middle School, and Andover High School.
Ownership History
Date
Name
Owned For
Owner Type
Purchase Details
Closed on
Feb 20, 2024
Sold by
Day David G and Day Tami S
Bought by
Day Ft and Day
Current Estimated Value
Purchase Details
Closed on
Aug 3, 2009
Sold by
Chapman John A and Relyea Linda M
Bought by
Day David G and Day Tami S
Home Financials for this Owner
Home Financials are based on the most recent Mortgage that was taken out on this home.
Original Mortgage
$204,000
Interest Rate
5.43%
Mortgage Type
Purchase Money Mortgage
Purchase Details
Closed on
Jul 14, 1995
Sold by
Akyuz Yusef
Bought by
Chapman John A
Create a Home Valuation Report for This Property
The Home Valuation Report is an in-depth analysis detailing your home's value as well as a comparison with similar homes in the area
Home Values in the Area
Average Home Value in this Area
Purchase History
We collect this data history from publicly available records. To have your information removed, we recommend requesting removal directly through your county’s website.
| Date | Buyer | Sale Price | Title Company |
|---|---|---|---|
| Day Ft | -- | None Available | |
| Day David G | $512,000 | -- | |
| Chapman John A | $299,000 | -- |
Source: Public Records
Mortgage History
We collect this data history from publicly available records. To have your information removed, we recommend requesting removal directly through your county’s website.
| Date | Status | Borrower | Loan Amount |
|---|---|---|---|
| Previous Owner | Chapman John A | $202,750 | |
| Previous Owner | Chapman John A | $204,000 | |
| Previous Owner | Day David G | $204,000 | |
| Previous Owner | Chapman John A | $75,000 |
Source: Public Records
Tax History
| Year | Tax Paid | Tax Assessment Tax Assessment Total Assessment is a certain percentage of the fair market value that is determined by local assessors to be the total taxable value of land and additions on the property. | Land | Improvement |
|---|---|---|---|---|
| 2025 | $12,833 | $1,027,500 | $616,800 | $410,700 |
| 2024 | $12,318 | $956,400 | $593,900 | $362,500 |
| 2023 | $11,813 | $864,800 | $535,500 | $329,300 |
| 2022 | $11,099 | $760,200 | $466,700 | $293,500 |
| 2021 | $10,633 | $695,400 | $424,900 | $270,500 |
| 2020 | $10,204 | $679,800 | $414,900 | $264,900 |
| 2019 | $9,758 | $639,000 | $379,600 | $259,400 |
| 2018 | $9,456 | $604,600 | $365,200 | $239,400 |
| 2017 | $9,041 | $595,600 | $358,200 | $237,400 |
| 2016 | $8,827 | $595,600 | $358,200 | $237,400 |
| 2015 | $8,519 | $569,100 | $344,700 | $224,400 |
Source: Public Records
Map
Nearby Homes
- 24 W Parish Dr
- 25 Crenshaw Ln Unit 15-2
- 12 Robert Dr Unit 12
- 4 Andover Country Club Ln
- 57 Juniper Rd
- 102 Argilla Rd
- 13 Leah Way
- 25 Clubview Dr Unit 25
- 27 Lincoln St
- 14 Samos Ln
- 2 Dove Ln Unit 2
- 4 Fairway Dr
- 11 Swan Ln Unit 11
- 21 Clubview Dr Unit 21
- 40 Lincoln Cir E
- 11 Cuba St
- 2 Brechin Terrace
- 2 Weeping Willow Dr
- 1 Delisio Dr
- 2 Powder Mill Square Unit 2B
Your Personal Tour Guide
Ask me questions while you tour the home.