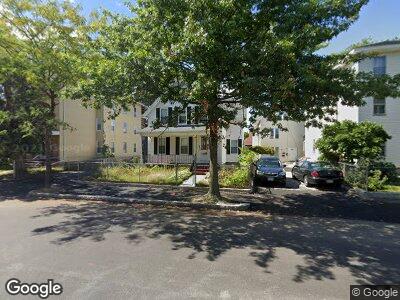
28 Florence St Worcester, MA 01610
University Park NeighborhoodEstimated Value: $401,000 - $488,000
4
Beds
2
Baths
2,163
Sq Ft
$209/Sq Ft
Est. Value
About This Home
This home is located at 28 Florence St, Worcester, MA 01610 and is currently estimated at $453,110, approximately $209 per square foot. 28 Florence St is a home located in Worcester County with nearby schools including Jacob Hiatt Magnet School, Columbus Park Preparatory Academy, and Chandler Magnet.
Ownership History
Date
Name
Owned For
Owner Type
Purchase Details
Closed on
Sep 13, 2010
Sold by
Nguyen-Trung Sang
Bought by
Le Tracyna
Current Estimated Value
Purchase Details
Closed on
Jun 6, 1994
Sold by
Dixon Jerome M and Dixon Lorraine
Bought by
Nguyen Sang T
Home Financials for this Owner
Home Financials are based on the most recent Mortgage that was taken out on this home.
Original Mortgage
$75,000
Interest Rate
8.49%
Mortgage Type
Purchase Money Mortgage
Create a Home Valuation Report for This Property
The Home Valuation Report is an in-depth analysis detailing your home's value as well as a comparison with similar homes in the area
Home Values in the Area
Average Home Value in this Area
Purchase History
| Date | Buyer | Sale Price | Title Company |
|---|---|---|---|
| Le Tracyna | -- | -- | |
| Nguyen Sang T | $84,000 | -- |
Source: Public Records
Mortgage History
| Date | Status | Borrower | Loan Amount |
|---|---|---|---|
| Previous Owner | Nguyen Sang T | $72,300 | |
| Previous Owner | Nguyen Sang T | $75,000 |
Source: Public Records
Tax History Compared to Growth
Tax History
| Year | Tax Paid | Tax Assessment Tax Assessment Total Assessment is a certain percentage of the fair market value that is determined by local assessors to be the total taxable value of land and additions on the property. | Land | Improvement |
|---|---|---|---|---|
| 2025 | $5,111 | $387,500 | $92,200 | $295,300 |
| 2024 | $4,876 | $354,600 | $92,200 | $262,400 |
| 2023 | $4,718 | $329,000 | $80,100 | $248,900 |
| 2022 | $4,397 | $289,100 | $64,100 | $225,000 |
| 2021 | $4,510 | $277,000 | $51,300 | $225,700 |
| 2020 | $4,272 | $251,300 | $50,900 | $200,400 |
| 2019 | $4,100 | $227,800 | $44,400 | $183,400 |
| 2018 | $4,083 | $215,900 | $44,400 | $171,500 |
| 2017 | $3,898 | $202,800 | $44,400 | $158,400 |
| 2016 | $3,957 | $192,000 | $32,300 | $159,700 |
| 2015 | $3,853 | $192,000 | $32,300 | $159,700 |
| 2014 | $3,752 | $192,000 | $32,300 | $159,700 |
Source: Public Records
Map
Nearby Homes