Estimated Value: $684,020 - $797,000
4
Beds
3
Baths
1,976
Sq Ft
$373/Sq Ft
Est. Value
About This Home
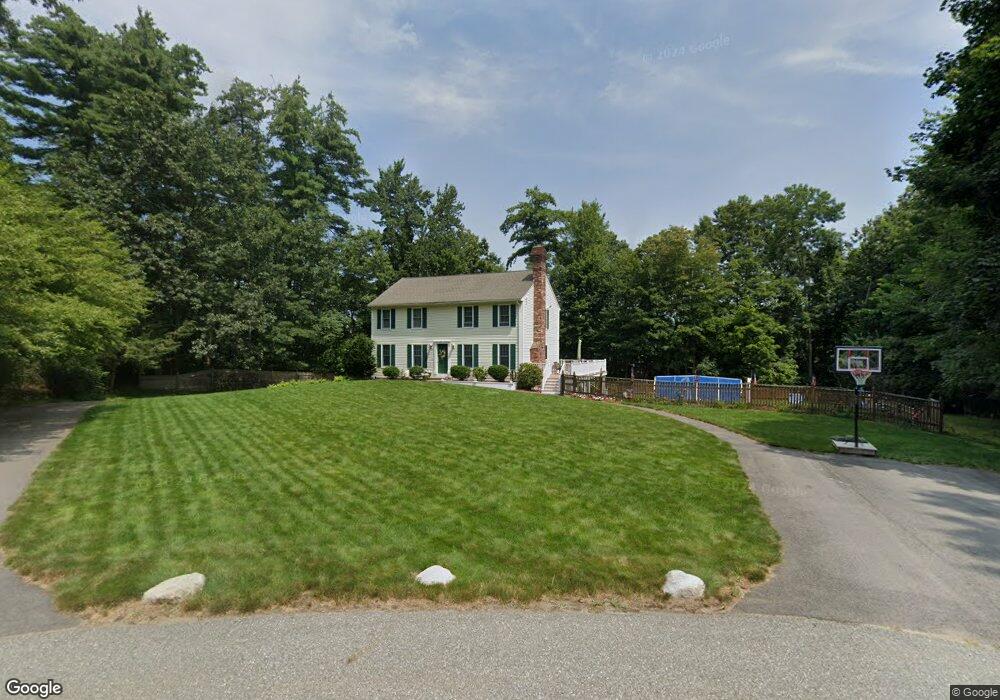
This home is located at 28 Mason Dr, Salem, NH 03079 and is currently estimated at $738,005, approximately $373 per square foot. 28 Mason Dr is a home located in Rockingham County with nearby schools including Mary A. Fisk Elementary School, Woodbury School, and Salem High School.
Ownership History
Date
Name
Owned For
Owner Type
Purchase Details
Closed on
Feb 22, 2016
Sold by
Dansereau Elaine M
Bought by
Dansereau Elaine M and Wilkinson Andrew J
Current Estimated Value
Purchase Details
Closed on
Oct 11, 2001
Sold by
C & R Rt
Bought by
Mayo Rt
Purchase Details
Closed on
Aug 1, 2001
Sold by
C & R Rt
Bought by
Dansereau Elaine M
Home Financials for this Owner
Home Financials are based on the most recent Mortgage that was taken out on this home.
Original Mortgage
$247,900
Interest Rate
7.14%
Create a Home Valuation Report for This Property
The Home Valuation Report is an in-depth analysis detailing your home's value as well as a comparison with similar homes in the area
Home Values in the Area
Average Home Value in this Area
Purchase History
| Date | Buyer | Sale Price | Title Company |
|---|---|---|---|
| Dansereau Elaine M | -- | -- | |
| Mayo Rt | $8,500 | -- | |
| Dansereau Elaine M | $309,900 | -- |
Source: Public Records
Mortgage History
| Date | Status | Borrower | Loan Amount |
|---|---|---|---|
| Previous Owner | Dansereau Elaine M | $126,044 | |
| Previous Owner | Dansereau Elaine M | $247,900 |
Source: Public Records
Tax History Compared to Growth
Tax History
| Year | Tax Paid | Tax Assessment Tax Assessment Total Assessment is a certain percentage of the fair market value that is determined by local assessors to be the total taxable value of land and additions on the property. | Land | Improvement |
|---|---|---|---|---|
| 2024 | $8,895 | $505,400 | $194,000 | $311,400 |
| 2023 | $8,572 | $505,400 | $194,000 | $311,400 |
| 2022 | $8,112 | $505,400 | $194,000 | $311,400 |
| 2021 | $8,076 | $505,400 | $194,000 | $311,400 |
| 2020 | $7,987 | $362,700 | $138,600 | $224,100 |
| 2019 | $7,972 | $362,700 | $138,600 | $224,100 |
| 2018 | $7,838 | $362,700 | $138,600 | $224,100 |
| 2017 | $7,559 | $362,700 | $138,600 | $224,100 |
| 2016 | $7,410 | $362,700 | $138,600 | $224,100 |
| 2015 | $6,783 | $317,100 | $136,400 | $180,700 |
| 2014 | $6,593 | $317,100 | $136,400 | $180,700 |
| 2013 | $6,488 | $317,100 | $136,400 | $180,700 |
Source: Public Records
Map
Nearby Homes
- 174 N Policy St
- 25 Range Rd
- 10 Harris Rd
- 10 Roulston Rd
- 2 Dennison Ave
- 17 Cole Rd
- 85 Shadow Lake Rd
- 30 Scotland Ave
- 24 Rolling Ridge Rd
- 3 S Shore Rd
- 51 Zion Hill Rd
- 11 Sullivan Ct
- 63 Searles Rd
- 17 Clinton St
- 108 S Shore Rd
- 6 Chadwick Cir
- 70 Governor Dinsmore Rd
- 49 Millville St
- 44 Trails Edge Rd
- 41 Trails Edge Rd