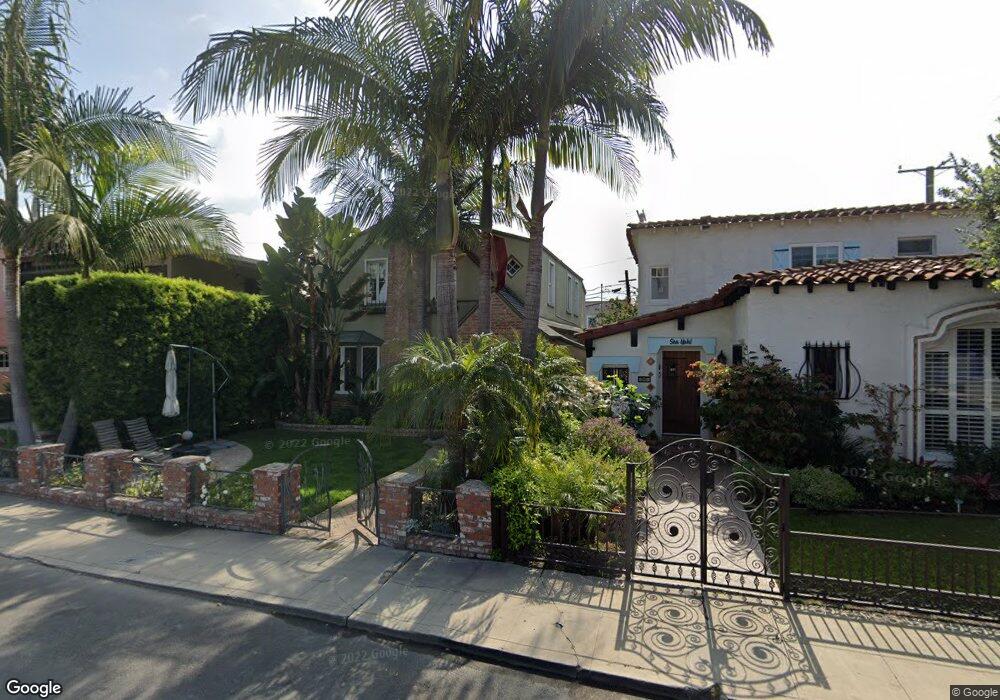
28 Prospect Ave Long Beach, CA 90803
Belmont Shore NeighborhoodEstimated Value: $1,474,072 - $1,759,000
3
Beds
2
Baths
1,997
Sq Ft
$786/Sq Ft
Est. Value
About This Home
This home is located at 28 Prospect Ave, Long Beach, CA 90803 and is currently estimated at $1,570,018, approximately $786 per square foot. 28 Prospect Ave is a home located in Los Angeles County with nearby schools including Lowell Elementary School, Rogers Middle School, and Woodrow Wilson High School.
Ownership History
Date
Name
Owned For
Owner Type
Purchase Details
Closed on
Mar 1, 2000
Sold by
Torbik Bernard A and Torbik Angela
Bought by
Steege Christopher M and Steege Brandi R
Current Estimated Value
Home Financials for this Owner
Home Financials are based on the most recent Mortgage that was taken out on this home.
Original Mortgage
$400,000
Outstanding Balance
$135,272
Interest Rate
8.26%
Estimated Equity
$1,434,746
Create a Home Valuation Report for This Property
The Home Valuation Report is an in-depth analysis detailing your home's value as well as a comparison with similar homes in the area
Home Values in the Area
Average Home Value in this Area
Purchase History
| Date | Buyer | Sale Price | Title Company |
|---|---|---|---|
| Steege Christopher M | $500,000 | Gateway Title |
Source: Public Records
Mortgage History
| Date | Status | Borrower | Loan Amount |
|---|---|---|---|
| Open | Steege Christopher M | $400,000 | |
| Closed | Steege Christopher M | $75,000 |
Source: Public Records
Tax History Compared to Growth
Tax History
| Year | Tax Paid | Tax Assessment Tax Assessment Total Assessment is a certain percentage of the fair market value that is determined by local assessors to be the total taxable value of land and additions on the property. | Land | Improvement |
|---|---|---|---|---|
| 2025 | $9,673 | $768,468 | $527,175 | $241,293 |
| 2024 | $9,673 | $753,401 | $516,839 | $236,562 |
| 2023 | $9,510 | $738,629 | $506,705 | $231,924 |
| 2022 | $8,923 | $724,147 | $496,770 | $227,377 |
| 2021 | $8,744 | $709,949 | $487,030 | $222,919 |
| 2019 | $8,617 | $688,894 | $472,586 | $216,308 |
| 2018 | $8,384 | $675,387 | $463,320 | $212,067 |
| 2016 | $7,704 | $649,163 | $445,330 | $203,833 |
| 2015 | $7,391 | $639,413 | $438,641 | $200,772 |
| 2014 | $7,333 | $626,889 | $430,049 | $196,840 |
Source: Public Records
Map
Nearby Homes
- 60 Bennett Ave
- 4257 E Ocean Blvd
- 111 Ximeno Ave
- 143 Roycroft Ave
- 28 Argonne Ave
- 75 Granada Ave
- 120 Granada Ave
- 116 Termino Ave
- 3939 E Allin St Unit 109
- 3901 E Livingston Dr Unit 402
- 176 Saint Joseph Ave
- 178 Saint Joseph Ave
- 164 Granada Ave
- 3811 E Livingston Dr Unit 1
- 202 Mira Mar Ave
- 3707 E Livingston Dr Unit 403
- 217 Quincy Ave Unit 2
- 227 Ximeno Ave
- 32 La Verne Ave
- 210 Grand Ave Unit 201
- 22 Prospect Ave
- 40 Prospect Ave
- 25 Quincy Ave
- 44 Prospect Ave
- 19 Quincy Ave
- 33 Quincy Ave
- 4507 E Ocean Blvd
- 2 Prospect Ave
- 4509 E Ocean Blvd
- 39 Quincy Ave
- 27 Prospect Ave
- 4515 E Ocean Blvd
- 35 Prospect Ave
- 21 Prospect Ave
- 50 Prospect Ave
- 53 Quincy Ave
- 39 Prospect Ave
- 4521 E Ocean Blvd
- 43 Prospect Ave
- 4435 E Ocean Blvd