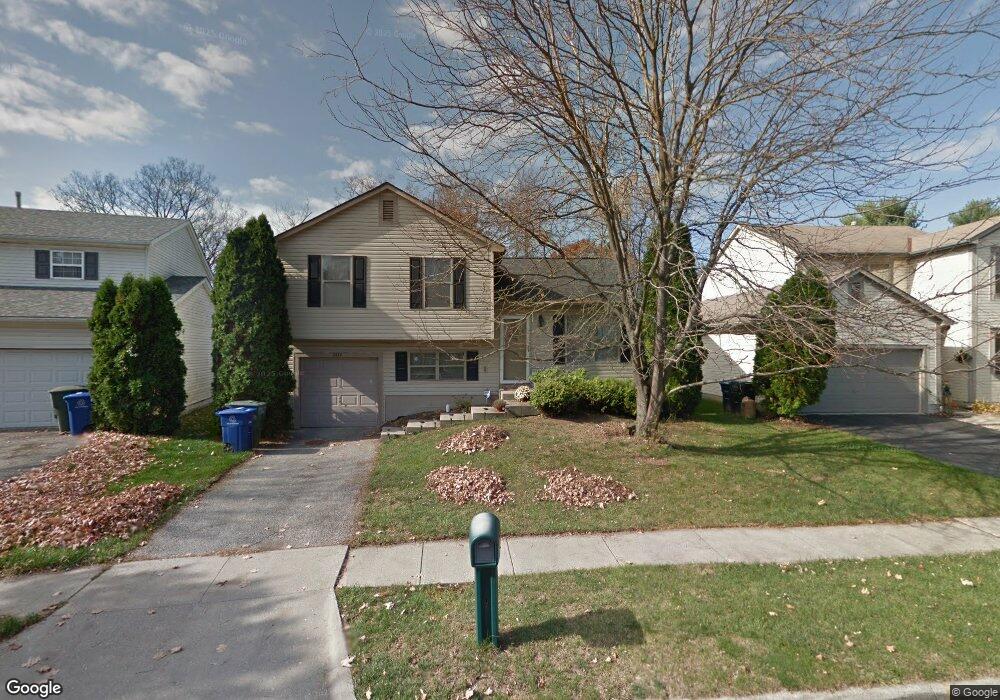
2819 Raphael Dr Columbus, OH 43232
Walnut Heights NeighborhoodEstimated Value: $223,740 - $263,000
3
Beds
2
Baths
1,290
Sq Ft
$184/Sq Ft
Est. Value
About This Home
This home is located at 2819 Raphael Dr, Columbus, OH 43232 and is currently estimated at $237,935, approximately $184 per square foot. 2819 Raphael Dr is a home located in Franklin County with nearby schools including Liberty Elementary School, Yorktown Middle School, and Independence High School.
Ownership History
Date
Name
Owned For
Owner Type
Purchase Details
Closed on
Jan 12, 2009
Sold by
Hsbc Bank Usa Na
Bought by
Dorton Yveetes
Current Estimated Value
Home Financials for this Owner
Home Financials are based on the most recent Mortgage that was taken out on this home.
Original Mortgage
$64,407
Outstanding Balance
$39,910
Interest Rate
5.14%
Mortgage Type
FHA
Estimated Equity
$198,025
Purchase Details
Closed on
Sep 30, 2008
Sold by
Sims Hollis and Case #07Cve10 14810
Bought by
Hsbc Bank Usa Na
Purchase Details
Closed on
Mar 7, 2005
Sold by
Besco Llc
Bought by
Sims Hollis and Sims Virgie
Home Financials for this Owner
Home Financials are based on the most recent Mortgage that was taken out on this home.
Original Mortgage
$120,000
Interest Rate
8.75%
Mortgage Type
Purchase Money Mortgage
Purchase Details
Closed on
Sep 22, 1997
Sold by
Diatom Corporation
Bought by
Autumnwood Homes Inc
Home Financials for this Owner
Home Financials are based on the most recent Mortgage that was taken out on this home.
Original Mortgage
$83,200
Interest Rate
7.55%
Create a Home Valuation Report for This Property
The Home Valuation Report is an in-depth analysis detailing your home's value as well as a comparison with similar homes in the area
Home Values in the Area
Average Home Value in this Area
Purchase History
| Date | Buyer | Sale Price | Title Company |
|---|---|---|---|
| Dorton Yveetes | $64,900 | Titlequest | |
| Hsbc Bank Usa Na | $68,000 | Independent | |
| Sims Hollis | $120,000 | Lawyers Tit | |
| Autumnwood Homes Inc | -- | -- |
Source: Public Records
Mortgage History
| Date | Status | Borrower | Loan Amount |
|---|---|---|---|
| Open | Dorton Yveetes | $64,407 | |
| Previous Owner | Sims Hollis | $120,000 | |
| Previous Owner | Autumnwood Homes Inc | $83,200 |
Source: Public Records
Tax History
| Year | Tax Paid | Tax Assessment Tax Assessment Total Assessment is a certain percentage of the fair market value that is determined by local assessors to be the total taxable value of land and additions on the property. | Land | Improvement |
|---|---|---|---|---|
| 2025 | $2,661 | $59,300 | $16,980 | $42,320 |
| 2024 | $2,661 | $59,300 | $16,980 | $42,320 |
| 2023 | $2,627 | $59,290 | $16,975 | $42,315 |
| 2022 | $1,788 | $34,480 | $6,300 | $28,180 |
| 2021 | $1,791 | $34,480 | $6,300 | $28,180 |
| 2020 | $1,794 | $34,480 | $6,300 | $28,180 |
| 2019 | $1,748 | $28,810 | $5,250 | $23,560 |
| 2018 | $1,696 | $28,810 | $5,250 | $23,560 |
| 2017 | $1,781 | $28,810 | $5,250 | $23,560 |
| 2016 | $1,816 | $27,410 | $6,020 | $21,390 |
| 2015 | $1,648 | $27,410 | $6,020 | $21,390 |
| 2014 | $1,652 | $27,410 | $6,020 | $21,390 |
| 2013 | $906 | $30,450 | $6,685 | $23,765 |
Source: Public Records
Map
Nearby Homes
- 2730 Raphael Dr
- 5326 Adderley Ave
- 2744 Barrows Rd
- 2736 Barrows Rd
- 2700 Raphael Dr
- 2706 Moundcrest St
- 5278 Glenbriar Ct
- 5414 Paladim Rd
- 2900 Gentry Ln
- 2651 Brownfield Rd
- 5373 Spire Ln
- 5137 Holbrook Dr
- 5290 Quincy Dr
- 2608 Hubbell Rd
- 2998 Osgood Rd E
- 5882 Abernathy Ln Unit 5882F
- 5944 Abernathy Ln
- 5946 Abernathy Ln
- 5960 Abernathy Ln
- 5361 Parkline Dr
- 2813 Raphael Dr
- 2825 Raphael Dr
- 2807 Raphael Dr
- 2832 Millvale St
- 2840 Millvale St
- 2824 Millvale St
- 2829 Raphael Dr
- 2801 Raphael Dr
- 2816 Millvale St
- 2818 Raphael Dr
- 2826 Raphael Dr
- 2810 Raphael Dr
- 2837 Raphael Dr
- 2795 Raphael Dr
- 2808 Millvale St
- 2802 Raphael Dr
- 2845 Raphael Dr
- 2789 Raphael Dr
- 2831 Millvale St
- 2802 Millvale St
Your Personal Tour Guide
Ask me questions while you tour the home.