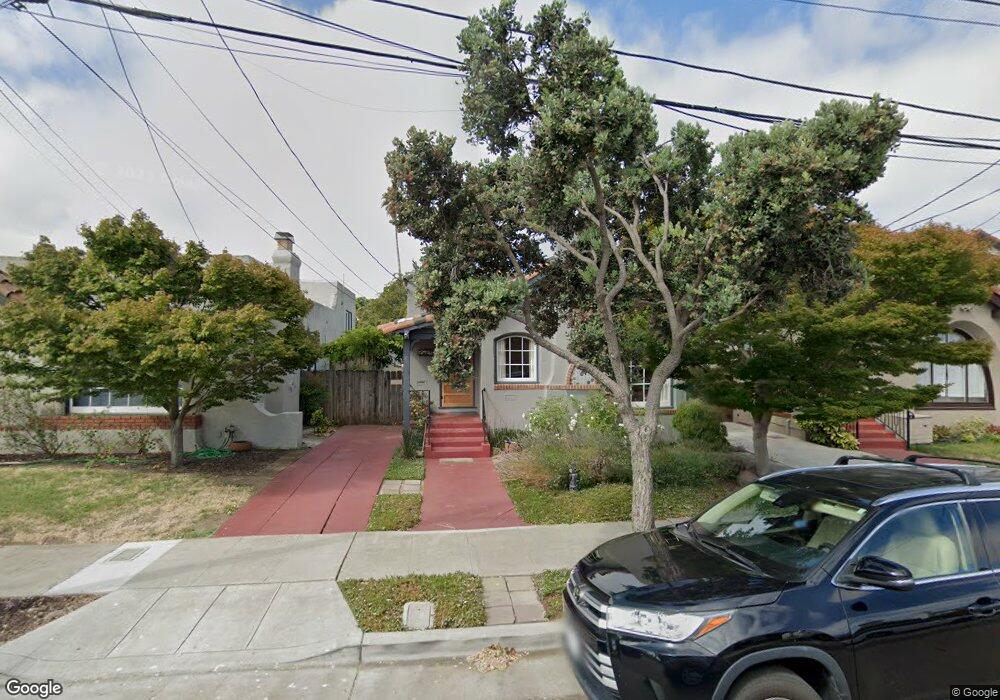
2828 Clay St Alameda, CA 94501
South Shore NeighborhoodEstimated Value: $944,725 - $1,146,000
2
Beds
1
Bath
1,208
Sq Ft
$830/Sq Ft
Est. Value
About This Home
This home is located at 2828 Clay St, Alameda, CA 94501 and is currently estimated at $1,002,681, approximately $830 per square foot. 2828 Clay St is a home located in Alameda County with nearby schools including Frank Otis Elementary School, Lincoln Middle School, and Alameda High School.
Ownership History
Date
Name
Owned For
Owner Type
Purchase Details
Closed on
Dec 23, 2013
Sold by
Neill Derrick P O and Neill Pamela C O
Bought by
Neill Derrick P O and Neill Pamela C O
Current Estimated Value
Home Financials for this Owner
Home Financials are based on the most recent Mortgage that was taken out on this home.
Original Mortgage
$399,000
Outstanding Balance
$299,514
Interest Rate
4.32%
Mortgage Type
New Conventional
Estimated Equity
$703,167
Purchase Details
Closed on
Oct 28, 1998
Sold by
Mason James G and Mason Nancy O
Bought by
Oneill Derrick P and Oneill Pamela C
Home Financials for this Owner
Home Financials are based on the most recent Mortgage that was taken out on this home.
Original Mortgage
$202,500
Interest Rate
6.61%
Create a Home Valuation Report for This Property
The Home Valuation Report is an in-depth analysis detailing your home's value as well as a comparison with similar homes in the area
Home Values in the Area
Average Home Value in this Area
Purchase History
| Date | Buyer | Sale Price | Title Company |
|---|---|---|---|
| Neill Derrick P O | -- | Old Republic Title Company | |
| Oneill Derrick P | $101,500 | Placer Title Company |
Source: Public Records
Mortgage History
| Date | Status | Borrower | Loan Amount |
|---|---|---|---|
| Open | Neill Derrick P O | $399,000 | |
| Closed | Oneill Derrick P | $202,500 |
Source: Public Records
Tax History Compared to Growth
Tax History
| Year | Tax Paid | Tax Assessment Tax Assessment Total Assessment is a certain percentage of the fair market value that is determined by local assessors to be the total taxable value of land and additions on the property. | Land | Improvement |
|---|---|---|---|---|
| 2025 | $6,097 | $352,714 | $109,733 | $242,981 |
| 2024 | $6,097 | $345,799 | $107,582 | $238,217 |
| 2023 | $5,886 | $339,020 | $105,473 | $233,547 |
| 2022 | $5,762 | $332,374 | $103,405 | $228,969 |
| 2021 | $5,633 | $325,858 | $101,378 | $224,480 |
| 2020 | $5,567 | $322,516 | $100,338 | $222,178 |
| 2019 | $5,144 | $316,194 | $98,371 | $217,823 |
| 2018 | $5,024 | $309,995 | $96,443 | $213,552 |
| 2017 | $4,818 | $303,918 | $94,552 | $209,366 |
| 2016 | $4,810 | $297,959 | $92,698 | $205,261 |
| 2015 | $4,790 | $293,484 | $91,306 | $202,178 |
| 2014 | $4,597 | $287,736 | $89,518 | $198,218 |
Source: Public Records
Map
Nearby Homes
- 2829 Otis Dr
- 975 Pearl St
- 2839 Washington St
- 3171 Bayview Dr
- 3012 Bayview Dr
- 2848 San Jose Ave
- 3208 Washington St
- 1024 Regent St
- 1238 Versailles Ave
- 1210 Broadway Unit A
- 2431 Roosevelt Dr
- 1100 Park Ave
- 2620 Encinal Ave
- 954 Park St
- 935 Park St
- 2959 Sea View Pkwy
- 840 Oak St
- 3103 Central Ave
- 2417 Marti Rae Ct
- 137 Parfait Ln