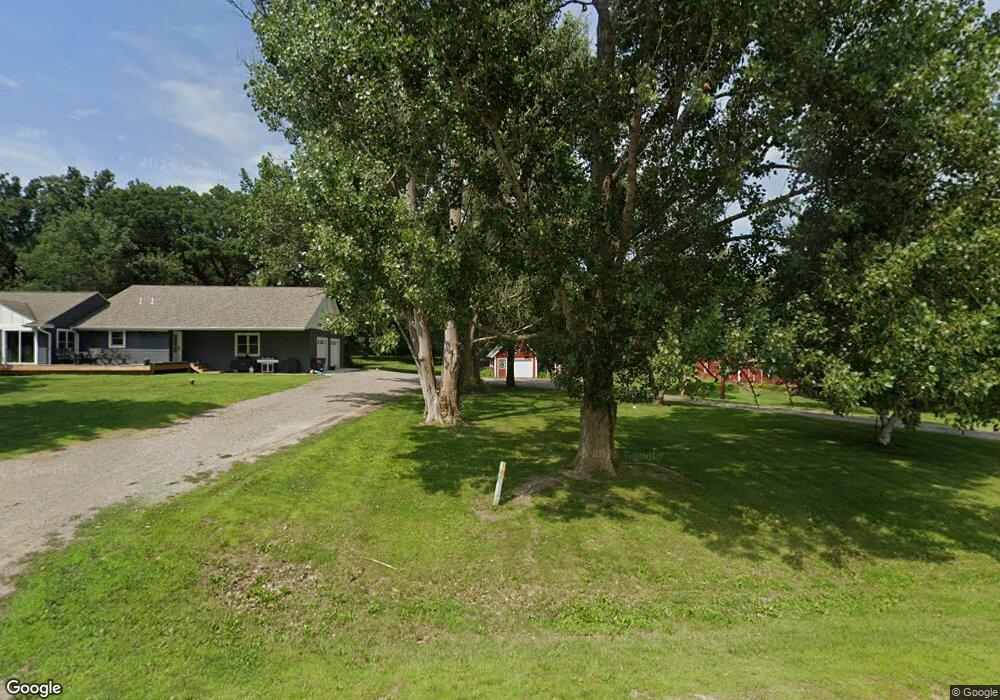
28811 Csah 21 Dassel, MN 55325
Estimated Value: $358,000 - $506,000
4
Beds
2
Baths
1,869
Sq Ft
$237/Sq Ft
Est. Value
About This Home
This home is located at 28811 Csah 21, Dassel, MN 55325 and is currently estimated at $442,393, approximately $236 per square foot. 28811 Csah 21 is a home located in Meeker County with nearby schools including Lake Ripley Elementary School, Litchfield Middle School, and Litchfield Senior High School.
Ownership History
Date
Name
Owned For
Owner Type
Purchase Details
Closed on
Feb 26, 2024
Sold by
Pettit Dana
Bought by
Pettit Jason A
Current Estimated Value
Home Financials for this Owner
Home Financials are based on the most recent Mortgage that was taken out on this home.
Original Mortgage
$380,000
Outstanding Balance
$372,092
Interest Rate
6.69%
Mortgage Type
VA
Estimated Equity
$70,301
Purchase Details
Closed on
May 22, 2020
Sold by
Johnson Carla Jo and Johnson Allen William
Bought by
Pettit Dana and Pettit Jason M
Home Financials for this Owner
Home Financials are based on the most recent Mortgage that was taken out on this home.
Original Mortgage
$223,250
Interest Rate
3.3%
Mortgage Type
New Conventional
Purchase Details
Closed on
Sep 17, 2015
Sold by
Mcdonald Grant Grant
Bought by
Werner Carla Carla
Home Financials for this Owner
Home Financials are based on the most recent Mortgage that was taken out on this home.
Original Mortgage
$184,000
Interest Rate
3.91%
Create a Home Valuation Report for This Property
The Home Valuation Report is an in-depth analysis detailing your home's value as well as a comparison with similar homes in the area
Purchase History
| Date | Buyer | Sale Price | Title Company |
|---|---|---|---|
| Pettit Jason A | -- | Partners Title Llc | |
| Pettit Dana | $235,000 | Title Mark Llc | |
| Werner Carla Carla | $185,000 | -- |
Source: Public Records
Mortgage History
| Date | Status | Borrower | Loan Amount |
|---|---|---|---|
| Open | Pettit Jason A | $380,000 | |
| Previous Owner | Pettit Dana | $223,250 | |
| Previous Owner | Werner Carla Carla | $184,000 |
Source: Public Records
Tax History
| Year | Tax Paid | Tax Assessment Tax Assessment Total Assessment is a certain percentage of the fair market value that is determined by local assessors to be the total taxable value of land and additions on the property. | Land | Improvement |
|---|---|---|---|---|
| 2025 | $2,420 | $416,700 | $100,400 | $316,300 |
| 2024 | $2,420 | $261,700 | $65,500 | $196,200 |
| 2023 | $2,116 | $245,000 | $65,500 | $179,500 |
| 2022 | $2,004 | $207,600 | $58,100 | $149,500 |
| 2021 | $1,806 | $186,300 | $51,500 | $134,800 |
| 2020 | $1,558 | $158,900 | $51,500 | $107,400 |
| 2019 | $1,232 | $153,200 | $48,500 | $104,700 |
| 2018 | $1,232 | $149,700 | $48,500 | $101,200 |
| 2017 | $1,098 | $147,000 | $48,500 | $98,500 |
| 2016 | $1,056 | $128,600 | $46,500 | $82,100 |
| 2015 | $1,198 | $0 | $0 | $0 |
| 2014 | $1,198 | $0 | $0 | $0 |
Source: Public Records
Map
Nearby Homes
- 72295 273rd St
- 30892 722nd Ave
- 27509 742nd Ave
- 25306 Csah 4
- TBD Co Rd 4
- 72714 250th St
- 24131 Mn Highway 15
- 23120 705th Ave
- 1218 Summit Cove
- 1140 Summit Cove
- 72959 235th St
- 23441 735th Ave
- 641 Pleasant St
- 205 Circle View Dr
- 103 Sellards Ave
- 521 Maple St
- 307 Circle View Dr
- 415 Atlantic Ave E
- 901 Sellards Dr
- 160 Pacific Ave E
Your Personal Tour Guide
Ask me questions while you tour the home.