
Seller's Agent in 2025
Abby Phillips
EXIT Realty Midwest
(712) 540-1356
49 Total Sales


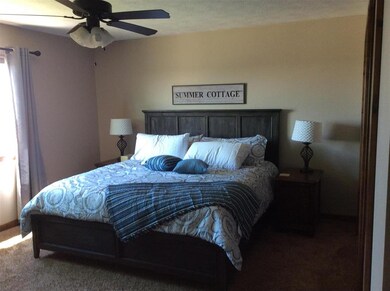
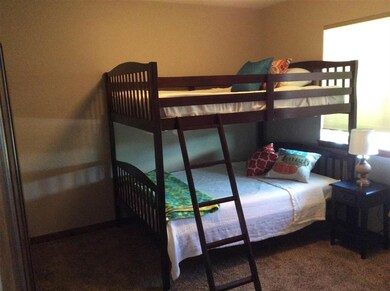

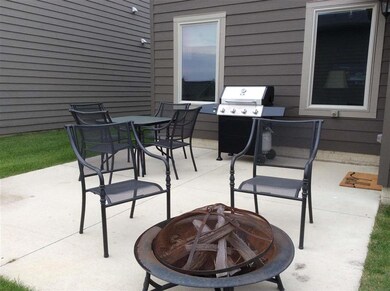
Totally turnkey unit for a great price. This property is just steps from the pool! Enjoy 3 bedrooms, 2.5 baths with a full bathroom attached to the master bedroom. Fully furnished unit makes this a great opportunity vs buying new.
Last Agent to Sell the Property
RE/MAX Lakes Realty License #B61252 Listed on: 02/06/2018
Home Type
Est. Annual Taxes
Year Built
Lot Details
HOA Fees
Parking
Home Design
Interior Spaces
Bedrooms and Bathrooms
Pool
Outdoor Features
Utilities
Listing and Financial Details
Overview
Recreation
| Date | Event | Price | Change | Sq Ft Price |
|---|---|---|---|---|
| 07/06/2025 07/06/25 | For Sale | $429,000 | +15.9% | $261 / Sq Ft |
| 12/23/2024 12/23/24 | Sold | $370,000 | -25.2% | $320 / Sq Ft |
| 12/19/2024 12/19/24 | Sold | $494,900 | +33.8% | $271 / Sq Ft |
| 12/17/2024 12/17/24 | Pending | -- | -- | -- |
| 12/17/2024 12/17/24 | For Sale | $370,000 | -14.0% | $320 / Sq Ft |
| 12/12/2024 12/12/24 | Pending | -- | -- | -- |
| 11/08/2024 11/08/24 | Sold | $430,000 | -4.4% | $344 / Sq Ft |
| 11/01/2024 11/01/24 | Sold | $449,800 | -9.1% | $389 / Sq Ft |
| 10/29/2024 10/29/24 | For Sale | $494,900 | -10.0% | $271 / Sq Ft |
| 10/28/2024 10/28/24 | Sold | $550,000 | -11.9% | $260 / Sq Ft |
| 10/22/2024 10/22/24 | Pending | -- | -- | -- |
| 10/18/2024 10/18/24 | Sold | $624,000 | +45.1% | $233 / Sq Ft |
| 10/09/2024 10/09/24 | For Sale | $430,000 | -25.2% | $344 / Sq Ft |
| 10/08/2024 10/08/24 | Sold | $575,000 | +23.7% | $352 / Sq Ft |
| 09/24/2024 09/24/24 | Pending | -- | -- | -- |
| 09/20/2024 09/20/24 | Sold | $465,000 | +3.6% | $374 / Sq Ft |
| 09/12/2024 09/12/24 | For Sale | $448,900 | -29.3% | $389 / Sq Ft |
| 09/11/2024 09/11/24 | Pending | -- | -- | -- |
| 08/29/2024 08/29/24 | For Sale | $634,900 | +7.8% | $237 / Sq Ft |
| 08/28/2024 08/28/24 | For Sale | $589,000 | +0.7% | $361 / Sq Ft |
| 08/27/2024 08/27/24 | For Sale | $585,000 | +37.6% | $277 / Sq Ft |
| 08/09/2024 08/09/24 | Sold | $425,000 | +3.7% | $368 / Sq Ft |
| 07/29/2024 07/29/24 | Sold | $410,000 | -3.5% | $407 / Sq Ft |
| 07/27/2024 07/27/24 | Pending | -- | -- | -- |
| 07/25/2024 07/25/24 | Pending | -- | -- | -- |
| 07/16/2024 07/16/24 | For Sale | $425,000 | +1.2% | $368 / Sq Ft |
| 07/12/2024 07/12/24 | Sold | $420,000 | -12.4% | $364 / Sq Ft |
| 07/05/2024 07/05/24 | Price Changed | $479,500 | +39.0% | $385 / Sq Ft |
| 07/02/2024 07/02/24 | Sold | $345,000 | -18.8% | $379 / Sq Ft |
| 06/26/2024 06/26/24 | Pending | -- | -- | -- |
| 06/24/2024 06/24/24 | Price Changed | $425,000 | +7.6% | $422 / Sq Ft |
| 06/24/2024 06/24/24 | Pending | -- | -- | -- |
| 06/18/2024 06/18/24 | Sold | $395,000 | +11.3% | $342 / Sq Ft |
| 05/30/2024 05/30/24 | Price Changed | $354,900 | -2.7% | $390 / Sq Ft |
| 05/28/2024 05/28/24 | Price Changed | $364,900 | -12.1% | $401 / Sq Ft |
| 05/24/2024 05/24/24 | Pending | -- | -- | -- |
| 05/24/2024 05/24/24 | For Sale | $414,900 | -2.4% | $359 / Sq Ft |
| 05/24/2024 05/24/24 | For Sale | $424,900 | +13.3% | $368 / Sq Ft |
| 05/21/2024 05/21/24 | Price Changed | $374,900 | -20.2% | $412 / Sq Ft |
| 04/30/2024 04/30/24 | Sold | $470,000 | +17.8% | $282 / Sq Ft |
| 04/25/2024 04/25/24 | For Sale | $399,000 | -17.3% | $438 / Sq Ft |
| 03/27/2024 03/27/24 | Price Changed | $482,500 | +10.9% | $388 / Sq Ft |
| 03/21/2024 03/21/24 | For Sale | $435,000 | -10.3% | $432 / Sq Ft |
| 02/22/2024 02/22/24 | For Sale | $485,000 | 0.0% | $291 / Sq Ft |
| 02/22/2024 02/22/24 | For Sale | $485,000 | +14.1% | $390 / Sq Ft |
| 01/09/2024 01/09/24 | Pending | -- | -- | -- |
| 01/05/2024 01/05/24 | Sold | $425,000 | -5.3% | $310 / Sq Ft |
| 12/18/2023 12/18/23 | Pending | -- | -- | -- |
| 12/05/2023 12/05/23 | For Sale | $449,000 | -5.5% | $328 / Sq Ft |
| 11/17/2023 11/17/23 | Sold | $475,000 | +10.7% | $298 / Sq Ft |
| 09/06/2023 09/06/23 | Pending | -- | -- | -- |
| 07/10/2023 07/10/23 | Sold | $429,000 | -12.4% | $426 / Sq Ft |
| 05/12/2023 05/12/23 | For Sale | $489,900 | +14.2% | $307 / Sq Ft |
| 04/07/2023 04/07/23 | For Sale | $429,000 | -4.7% | $426 / Sq Ft |
| 03/29/2023 03/29/23 | Sold | $450,000 | 0.0% | $284 / Sq Ft |
| 02/01/2023 02/01/23 | Pending | -- | -- | -- |
| 01/25/2023 01/25/23 | For Sale | $450,000 | 0.0% | $284 / Sq Ft |
| 11/07/2022 11/07/22 | Rented | $1,600 | 0.0% | -- |
| 10/21/2022 10/21/22 | Sold | $459,000 | +4.3% | $270 / Sq Ft |
| 10/15/2022 10/15/22 | Pending | -- | -- | -- |
| 10/14/2022 10/14/22 | Sold | $440,000 | 0.0% | $313 / Sq Ft |
| 10/13/2022 10/13/22 | For Rent | $1,600 | 0.0% | -- |
| 09/28/2022 09/28/22 | Pending | -- | -- | -- |
| 09/07/2022 09/07/22 | For Sale | $459,000 | +0.9% | $270 / Sq Ft |
| 08/08/2022 08/08/22 | Price Changed | $455,000 | -3.2% | $324 / Sq Ft |
| 06/28/2022 06/28/22 | For Sale | $469,900 | +34.6% | $335 / Sq Ft |
| 04/08/2022 04/08/22 | Sold | $349,000 | -23.1% | $404 / Sq Ft |
| 03/31/2022 03/31/22 | Sold | $454,000 | +30.1% | $235 / Sq Ft |
| 03/04/2022 03/04/22 | Pending | -- | -- | -- |
| 02/27/2022 02/27/22 | For Sale | $349,000 | -24.9% | $404 / Sq Ft |
| 11/29/2021 11/29/21 | Pending | -- | -- | -- |
| 11/26/2021 11/26/21 | For Sale | $465,000 | +45.3% | $241 / Sq Ft |
| 11/05/2021 11/05/21 | Sold | $320,000 | -1.5% | $371 / Sq Ft |
| 09/07/2021 09/07/21 | For Sale | $324,900 | -1.5% | $376 / Sq Ft |
| 05/14/2021 05/14/21 | Sold | $330,000 | 0.0% | $208 / Sq Ft |
| 05/14/2021 05/14/21 | Pending | -- | -- | -- |
| 05/14/2021 05/14/21 | For Sale | $330,000 | +6.1% | $208 / Sq Ft |
| 03/05/2021 03/05/21 | Sold | $311,000 | +0.3% | $222 / Sq Ft |
| 01/22/2021 01/22/21 | Pending | -- | -- | -- |
| 01/10/2021 01/10/21 | For Sale | $310,000 | +5.1% | $221 / Sq Ft |
| 09/25/2020 09/25/20 | Sold | $295,000 | -1.3% | $255 / Sq Ft |
| 09/05/2020 09/05/20 | Pending | -- | -- | -- |
| 09/04/2020 09/04/20 | For Sale | $299,000 | +9.3% | $259 / Sq Ft |
| 08/10/2020 08/10/20 | Sold | $273,500 | -17.6% | $171 / Sq Ft |
| 08/10/2020 08/10/20 | Pending | -- | -- | -- |
| 04/17/2020 04/17/20 | Sold | $332,000 | +47.6% | $157 / Sq Ft |
| 04/17/2020 04/17/20 | Sold | $225,000 | -21.8% | $247 / Sq Ft |
| 04/13/2020 04/13/20 | Pending | -- | -- | -- |
| 04/09/2020 04/09/20 | For Sale | $287,900 | -14.0% | $180 / Sq Ft |
| 03/10/2020 03/10/20 | Pending | -- | -- | -- |
| 03/04/2020 03/04/20 | For Sale | $334,900 | +31.3% | $159 / Sq Ft |
| 09/25/2019 09/25/19 | Sold | $255,000 | 0.0% | $221 / Sq Ft |
| 09/25/2019 09/25/19 | Pending | -- | -- | -- |
| 09/25/2019 09/25/19 | For Sale | $255,000 | +3.2% | $221 / Sq Ft |
| 07/09/2019 07/09/19 | For Sale | $247,000 | +1.2% | $271 / Sq Ft |
| 03/08/2019 03/08/19 | Sold | $244,000 | +6.8% | $198 / Sq Ft |
| 02/20/2019 02/20/19 | Pending | -- | -- | -- |
| 01/17/2019 01/17/19 | Sold | $228,500 | -7.7% | $265 / Sq Ft |
| 01/14/2019 01/14/19 | For Sale | $247,500 | +5.3% | $201 / Sq Ft |
| 01/09/2019 01/09/19 | Pending | -- | -- | -- |
| 11/13/2018 11/13/18 | For Sale | $235,000 | -6.0% | $272 / Sq Ft |
| 07/13/2018 07/13/18 | Sold | $249,900 | 0.0% | $224 / Sq Ft |
| 07/12/2018 07/12/18 | Pending | -- | -- | -- |
| 07/12/2018 07/12/18 | For Sale | $249,900 | +4.1% | $224 / Sq Ft |
| 06/01/2018 06/01/18 | Sold | $240,000 | +0.8% | $167 / Sq Ft |
| 05/11/2018 05/11/18 | Pending | -- | -- | -- |
| 04/13/2018 04/13/18 | Sold | $238,000 | -6.6% | $191 / Sq Ft |
| 04/09/2018 04/09/18 | For Sale | $254,900 | +7.3% | $178 / Sq Ft |
| 04/06/2018 04/06/18 | Pending | -- | -- | -- |
| 02/06/2018 02/06/18 | For Sale | $237,500 | +13.1% | $191 / Sq Ft |
| 11/10/2017 11/10/17 | Sold | $210,000 | -4.1% | $181 / Sq Ft |
| 11/08/2017 11/08/17 | Pending | -- | -- | -- |
| 09/25/2017 09/25/17 | For Sale | $219,000 | -6.0% | $188 / Sq Ft |
| 06/23/2017 06/23/17 | Sold | $232,900 | -2.1% | $164 / Sq Ft |
| 06/21/2017 06/21/17 | Pending | -- | -- | -- |
| 06/15/2017 06/15/17 | Sold | $238,000 | +2.2% | $206 / Sq Ft |
| 06/07/2017 06/07/17 | Pending | -- | -- | -- |
| 05/03/2017 05/03/17 | For Sale | $232,900 | -4.9% | $164 / Sq Ft |
| 04/10/2017 04/10/17 | For Sale | $245,000 | +11.4% | $212 / Sq Ft |
| 12/28/2016 12/28/16 | Sold | $220,000 | 0.0% | $183 / Sq Ft |
| 12/20/2016 12/20/16 | Pending | -- | -- | -- |
| 10/26/2016 10/26/16 | For Sale | $219,900 | -- | $183 / Sq Ft |
| Year | Tax Paid | Tax Assessment Tax Assessment Total Assessment is a certain percentage of the fair market value that is determined by local assessors to be the total taxable value of land and additions on the property. | Land | Improvement |
|---|---|---|---|---|
| 2024 | $3,808 | $375,700 | $59,200 | $316,500 |
| 2023 | $2,648 | $374,900 | $58,400 | $316,500 |
| 2022 | $2,514 | $220,300 | $49,200 | $171,100 |
| 2021 | $2,514 | $222,100 | $51,000 | $171,100 |
| 2020 | $2,364 | $198,500 | $41,700 | $156,800 |
| 2019 | $2,308 | $198,500 | $41,700 | $156,800 |
| 2018 | $2,230 | $187,000 | $31,800 | $155,200 |
| 2017 | $2,230 | $187,100 | $31,900 | $155,200 |
| 2016 | $2,062 | $179,300 | $30,400 | $148,900 |
| 2015 | $1,982 | $179,400 | $30,500 | $148,900 |
| 2014 | $1,786 | $156,400 | $29,500 | $126,900 |
| 2013 | $1,676 | $156,700 | $29,800 | $126,900 |
Seller's Agent in 2025
Abby Phillips
EXIT Realty Midwest
(712) 540-1356
49 Total Sales
Seller Co-Listing Agent in 2025
Teresa Olson
EXIT Realty Midwest
(712) 260-0402
7 in this area
7 Total Sales
Seller's Agent in 2024
Aaron Jones
RE/MAX
(712) 320-9442
125 in this area
317 Total Sales
Seller's Agent in 2024
Kolette Delperdang
EXIT Realty Midwest
(712) 330-1805
9 in this area
57 Total Sales
Seller's Agent in 2024
Michael Jensen
Jensen Real Estate
(712) 320-7245
66 in this area
353 Total Sales
Seller's Agent in 2024
Jimy Mac Lenz
Hinn Real Estate
(712) 240-0695
3 in this area
56 Total Sales
Source: Iowa Great Lakes Board of REALTORS®
MLS Number: 180150
APN: 07-21-352-055
Disclaimer: Certain information contained herein is derived from information provided by parties other than Homes.com. All information provided is deemed reliable, but is not guaranteed to be accurate and should be independently verified.
![]() IDX information is provided exclusively for personal, non-commercial use, and may not be used for any purpose other than to identify prospective properties consumers may be interested in purchasing. Information is deemed reliable but not guaranteed.
IDX information is provided exclusively for personal, non-commercial use, and may not be used for any purpose other than to identify prospective properties consumers may be interested in purchasing. Information is deemed reliable but not guaranteed.