
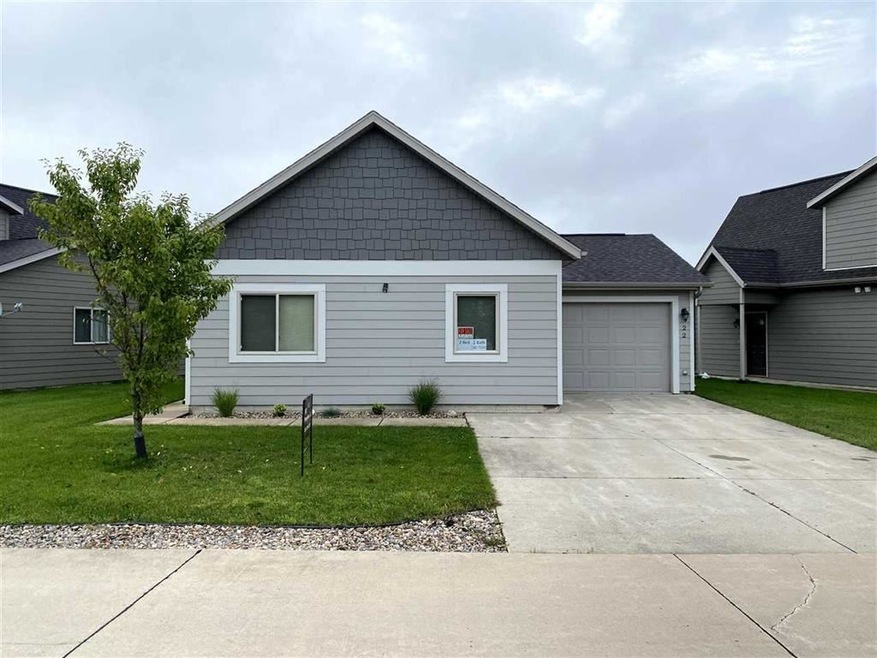
290 240th Ave Arnolds Park, IA 51331
2
Beds
2
Baths
863
Sq Ft
5,381
Sq Ft Lot
Highlights
- Community Pool
- 1 Car Attached Garage
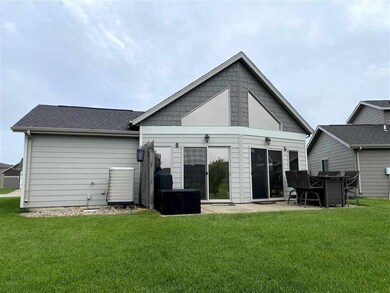
- Cabin
- Exercise Course
- Patio
- 1-Story Property
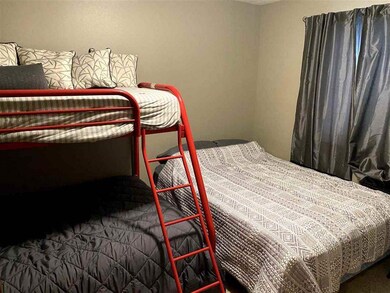
About This Home
As of December 2024Summer home or seasonal rental property, this home offers both! 2 bedrooms and 2 full bathrooms and walking distance to Bridge's Bay resort and restaurants, the cabin is in the heart of the lakes. Furnishings negotiable and turn key ready. Please allow 24 hour notice for any showings.
Last Agent to Sell the Property
Integrity Real Estate License #B44022 Listed on: 09/07/2021
Home Details
Home Type
- Single Family
Est. Annual Taxes
- $2,185
Year Built
- Built in 2009
Parking
- 1 Car Attached Garage
- Driveway
Home Design
- Cabin
- Poured Concrete
- Cement Siding
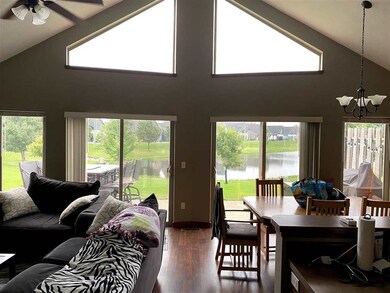
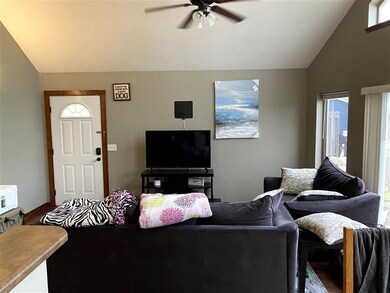
Interior Spaces
- 863 Sq Ft Home
- 1-Story Property
- Furnished or left unfurnished upon request
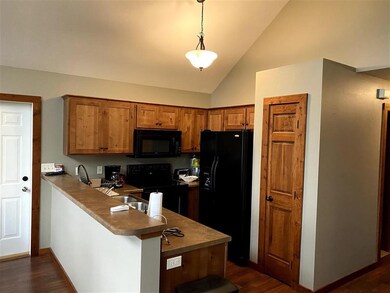
Kitchen
- Microwave
- Dishwasher
- Disposal
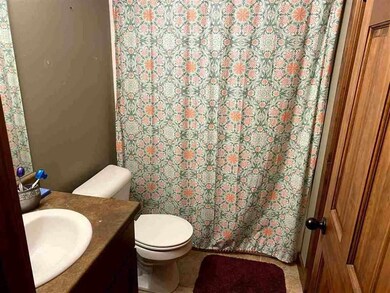
Bedrooms and Bathrooms
- 2 Bedrooms
- 2 Full Bathrooms
Laundry
- Laundry on main level
- Washer and Dryer Hookup
Additional Features
- Patio
- 5,381 Sq Ft Lot
- Heat Pump System
Community Details
- Exercise Course
- Community Pool
Listing and Financial Details
- Assessor Parcel Number 07-21-352-022
Similar Homes in Arnolds Park, IA
Create a Home Valuation Report for This Property
The Home Valuation Report is an in-depth analysis detailing your home's value as well as a comparison with similar homes in the area
Home Values in the Area
Average Home Value in this Area
Property History
| Date | Event | Price | Change | Sq Ft Price |
|---|---|---|---|---|
| 07/06/2025 07/06/25 | For Sale | $429,000 | +15.9% | $261 / Sq Ft |
| 12/23/2024 12/23/24 | Sold | $370,000 | -25.2% | $320 / Sq Ft |
| 12/19/2024 12/19/24 | Sold | $494,900 | +33.8% | $271 / Sq Ft |
| 12/17/2024 12/17/24 | Pending | -- | -- | -- |
| 12/17/2024 12/17/24 | For Sale | $370,000 | -14.0% | $320 / Sq Ft |
| 12/12/2024 12/12/24 | Pending | -- | -- | -- |
| 11/08/2024 11/08/24 | Sold | $430,000 | -4.4% | $344 / Sq Ft |
| 11/01/2024 11/01/24 | Sold | $449,800 | -9.1% | $389 / Sq Ft |
| 10/29/2024 10/29/24 | For Sale | $494,900 | -10.0% | $271 / Sq Ft |
| 10/28/2024 10/28/24 | Sold | $550,000 | -11.9% | $260 / Sq Ft |
| 10/22/2024 10/22/24 | Pending | -- | -- | -- |
| 10/18/2024 10/18/24 | Sold | $624,000 | +45.1% | $233 / Sq Ft |
| 10/09/2024 10/09/24 | For Sale | $430,000 | -25.2% | $344 / Sq Ft |
| 10/08/2024 10/08/24 | Sold | $575,000 | +23.7% | $352 / Sq Ft |
| 09/24/2024 09/24/24 | Pending | -- | -- | -- |
| 09/20/2024 09/20/24 | Sold | $465,000 | +3.6% | $374 / Sq Ft |
| 09/12/2024 09/12/24 | For Sale | $448,900 | -29.3% | $389 / Sq Ft |
| 09/11/2024 09/11/24 | Pending | -- | -- | -- |
| 08/29/2024 08/29/24 | For Sale | $634,900 | +7.8% | $237 / Sq Ft |
| 08/28/2024 08/28/24 | For Sale | $589,000 | +0.7% | $361 / Sq Ft |
| 08/27/2024 08/27/24 | For Sale | $585,000 | +37.6% | $277 / Sq Ft |
| 08/09/2024 08/09/24 | Sold | $425,000 | +3.7% | $368 / Sq Ft |
| 07/29/2024 07/29/24 | Sold | $410,000 | -3.5% | $407 / Sq Ft |
| 07/27/2024 07/27/24 | Pending | -- | -- | -- |
| 07/25/2024 07/25/24 | Pending | -- | -- | -- |
| 07/16/2024 07/16/24 | For Sale | $425,000 | +1.2% | $368 / Sq Ft |
| 07/12/2024 07/12/24 | Sold | $420,000 | -12.4% | $364 / Sq Ft |
| 07/05/2024 07/05/24 | Price Changed | $479,500 | +39.0% | $385 / Sq Ft |
| 07/02/2024 07/02/24 | Sold | $345,000 | -18.8% | $379 / Sq Ft |
| 06/26/2024 06/26/24 | Pending | -- | -- | -- |
| 06/24/2024 06/24/24 | Price Changed | $425,000 | +7.6% | $422 / Sq Ft |
| 06/24/2024 06/24/24 | Pending | -- | -- | -- |
| 06/18/2024 06/18/24 | Sold | $395,000 | +11.3% | $342 / Sq Ft |
| 05/30/2024 05/30/24 | Price Changed | $354,900 | -2.7% | $390 / Sq Ft |
| 05/28/2024 05/28/24 | Price Changed | $364,900 | -12.1% | $401 / Sq Ft |
| 05/24/2024 05/24/24 | Pending | -- | -- | -- |
| 05/24/2024 05/24/24 | For Sale | $414,900 | -2.4% | $359 / Sq Ft |
| 05/24/2024 05/24/24 | For Sale | $424,900 | +13.3% | $368 / Sq Ft |
| 05/21/2024 05/21/24 | Price Changed | $374,900 | -20.2% | $412 / Sq Ft |
| 04/30/2024 04/30/24 | Sold | $470,000 | +17.8% | $282 / Sq Ft |
| 04/25/2024 04/25/24 | For Sale | $399,000 | -17.3% | $438 / Sq Ft |
| 03/27/2024 03/27/24 | Price Changed | $482,500 | +10.9% | $388 / Sq Ft |
| 03/21/2024 03/21/24 | For Sale | $435,000 | -10.3% | $432 / Sq Ft |
| 02/22/2024 02/22/24 | For Sale | $485,000 | 0.0% | $291 / Sq Ft |
| 02/22/2024 02/22/24 | For Sale | $485,000 | +14.1% | $390 / Sq Ft |
| 01/09/2024 01/09/24 | Pending | -- | -- | -- |
| 01/05/2024 01/05/24 | Sold | $425,000 | -5.3% | $310 / Sq Ft |
| 12/18/2023 12/18/23 | Pending | -- | -- | -- |
| 12/05/2023 12/05/23 | For Sale | $449,000 | -5.5% | $328 / Sq Ft |
| 11/17/2023 11/17/23 | Sold | $475,000 | +10.7% | $298 / Sq Ft |
| 09/06/2023 09/06/23 | Pending | -- | -- | -- |
| 07/10/2023 07/10/23 | Sold | $429,000 | -12.4% | $426 / Sq Ft |
| 05/12/2023 05/12/23 | For Sale | $489,900 | +14.2% | $307 / Sq Ft |
| 04/07/2023 04/07/23 | For Sale | $429,000 | -4.7% | $426 / Sq Ft |
| 03/29/2023 03/29/23 | Sold | $450,000 | 0.0% | $284 / Sq Ft |
| 02/01/2023 02/01/23 | Pending | -- | -- | -- |
| 01/25/2023 01/25/23 | For Sale | $450,000 | 0.0% | $284 / Sq Ft |
| 11/07/2022 11/07/22 | Rented | $1,600 | 0.0% | -- |
| 10/21/2022 10/21/22 | Sold | $459,000 | +4.3% | $270 / Sq Ft |
| 10/15/2022 10/15/22 | Pending | -- | -- | -- |
| 10/14/2022 10/14/22 | Sold | $440,000 | 0.0% | $313 / Sq Ft |
| 10/13/2022 10/13/22 | For Rent | $1,600 | 0.0% | -- |
| 09/28/2022 09/28/22 | Pending | -- | -- | -- |
| 09/07/2022 09/07/22 | For Sale | $459,000 | +0.9% | $270 / Sq Ft |
| 08/08/2022 08/08/22 | Price Changed | $455,000 | -3.2% | $324 / Sq Ft |
| 06/28/2022 06/28/22 | For Sale | $469,900 | +34.6% | $335 / Sq Ft |
| 04/08/2022 04/08/22 | Sold | $349,000 | -23.1% | $404 / Sq Ft |
| 03/31/2022 03/31/22 | Sold | $454,000 | +30.1% | $235 / Sq Ft |
| 03/04/2022 03/04/22 | Pending | -- | -- | -- |
| 02/27/2022 02/27/22 | For Sale | $349,000 | -24.9% | $404 / Sq Ft |
| 11/29/2021 11/29/21 | Pending | -- | -- | -- |
| 11/26/2021 11/26/21 | For Sale | $465,000 | +45.3% | $241 / Sq Ft |
| 11/05/2021 11/05/21 | Sold | $320,000 | -1.5% | $371 / Sq Ft |
| 09/07/2021 09/07/21 | For Sale | $324,900 | -1.5% | $376 / Sq Ft |
| 05/14/2021 05/14/21 | Sold | $330,000 | 0.0% | $208 / Sq Ft |
| 05/14/2021 05/14/21 | Pending | -- | -- | -- |
| 05/14/2021 05/14/21 | For Sale | $330,000 | +6.1% | $208 / Sq Ft |
| 03/05/2021 03/05/21 | Sold | $311,000 | +0.3% | $222 / Sq Ft |
| 01/22/2021 01/22/21 | Pending | -- | -- | -- |
| 01/10/2021 01/10/21 | For Sale | $310,000 | +5.1% | $221 / Sq Ft |
| 09/25/2020 09/25/20 | Sold | $295,000 | -1.3% | $255 / Sq Ft |
| 09/05/2020 09/05/20 | Pending | -- | -- | -- |
| 09/04/2020 09/04/20 | For Sale | $299,000 | +9.3% | $259 / Sq Ft |
| 08/10/2020 08/10/20 | Sold | $273,500 | -17.6% | $171 / Sq Ft |
| 08/10/2020 08/10/20 | Pending | -- | -- | -- |
| 04/17/2020 04/17/20 | Sold | $332,000 | +47.6% | $157 / Sq Ft |
| 04/17/2020 04/17/20 | Sold | $225,000 | -21.8% | $247 / Sq Ft |
| 04/13/2020 04/13/20 | Pending | -- | -- | -- |
| 04/09/2020 04/09/20 | For Sale | $287,900 | -14.0% | $180 / Sq Ft |
| 03/10/2020 03/10/20 | Pending | -- | -- | -- |
| 03/04/2020 03/04/20 | For Sale | $334,900 | +31.3% | $159 / Sq Ft |
| 09/25/2019 09/25/19 | Sold | $255,000 | 0.0% | $221 / Sq Ft |
| 09/25/2019 09/25/19 | Pending | -- | -- | -- |
| 09/25/2019 09/25/19 | For Sale | $255,000 | +3.2% | $221 / Sq Ft |
| 07/09/2019 07/09/19 | For Sale | $247,000 | +1.2% | $271 / Sq Ft |
| 03/08/2019 03/08/19 | Sold | $244,000 | +6.8% | $198 / Sq Ft |
| 02/20/2019 02/20/19 | Pending | -- | -- | -- |
| 01/17/2019 01/17/19 | Sold | $228,500 | -7.7% | $265 / Sq Ft |
| 01/14/2019 01/14/19 | For Sale | $247,500 | +5.3% | $201 / Sq Ft |
| 01/09/2019 01/09/19 | Pending | -- | -- | -- |
| 11/13/2018 11/13/18 | For Sale | $235,000 | -6.0% | $272 / Sq Ft |
| 07/13/2018 07/13/18 | Sold | $249,900 | 0.0% | $224 / Sq Ft |
| 07/12/2018 07/12/18 | Pending | -- | -- | -- |
| 07/12/2018 07/12/18 | For Sale | $249,900 | +4.1% | $224 / Sq Ft |
| 06/01/2018 06/01/18 | Sold | $240,000 | +0.8% | $167 / Sq Ft |
| 05/11/2018 05/11/18 | Pending | -- | -- | -- |
| 04/13/2018 04/13/18 | Sold | $238,000 | -6.6% | $191 / Sq Ft |
| 04/09/2018 04/09/18 | For Sale | $254,900 | +7.3% | $178 / Sq Ft |
| 04/06/2018 04/06/18 | Pending | -- | -- | -- |
| 02/06/2018 02/06/18 | For Sale | $237,500 | +13.1% | $191 / Sq Ft |
| 11/10/2017 11/10/17 | Sold | $210,000 | -4.1% | $181 / Sq Ft |
| 11/08/2017 11/08/17 | Pending | -- | -- | -- |
| 09/25/2017 09/25/17 | For Sale | $219,000 | -6.0% | $188 / Sq Ft |
| 06/23/2017 06/23/17 | Sold | $232,900 | -2.1% | $164 / Sq Ft |
| 06/21/2017 06/21/17 | Pending | -- | -- | -- |
| 06/15/2017 06/15/17 | Sold | $238,000 | +2.2% | $206 / Sq Ft |
| 06/07/2017 06/07/17 | Pending | -- | -- | -- |
| 05/03/2017 05/03/17 | For Sale | $232,900 | -4.9% | $164 / Sq Ft |
| 04/10/2017 04/10/17 | For Sale | $245,000 | +11.4% | $212 / Sq Ft |
| 12/28/2016 12/28/16 | Sold | $220,000 | 0.0% | $183 / Sq Ft |
| 12/20/2016 12/20/16 | Pending | -- | -- | -- |
| 10/26/2016 10/26/16 | For Sale | $219,900 | -- | $183 / Sq Ft |
Source: Iowa Great Lakes Board of REALTORS®
Tax History Compared to Growth
Tax History
| Year | Tax Paid | Tax Assessment Tax Assessment Total Assessment is a certain percentage of the fair market value that is determined by local assessors to be the total taxable value of land and additions on the property. | Land | Improvement |
|---|---|---|---|---|
| 2024 | $3,808 | $375,700 | $59,200 | $316,500 |
| 2023 | $2,648 | $374,900 | $58,400 | $316,500 |
| 2022 | $2,514 | $220,300 | $49,200 | $171,100 |
| 2021 | $2,514 | $222,100 | $51,000 | $171,100 |
| 2020 | $2,364 | $198,500 | $41,700 | $156,800 |
| 2019 | $2,308 | $198,500 | $41,700 | $156,800 |
| 2018 | $2,230 | $187,000 | $31,800 | $155,200 |
| 2017 | $2,230 | $187,100 | $31,900 | $155,200 |
| 2016 | $2,062 | $179,300 | $30,400 | $148,900 |
| 2015 | $1,982 | $179,400 | $30,500 | $148,900 |
| 2014 | $1,786 | $156,400 | $29,500 | $126,900 |
| 2013 | $1,676 | $156,700 | $29,800 | $126,900 |
Source: Public Records
Agents Affiliated with this Home
-
Abby Phillips
Seller's Agent in 2025
Abby Phillips
EXIT Realty Midwest
(712) 540-1356
49 Total Sales
-
Teresa Olson
Seller Co-Listing Agent in 2025
Teresa Olson
EXIT Realty Midwest
(712) 260-0402
7 in this area
7 Total Sales
-
Aaron Jones
Seller's Agent in 2024
Aaron Jones
RE/MAX
(712) 320-9442
125 in this area
317 Total Sales
-
Kolette Delperdang
Seller's Agent in 2024
Kolette Delperdang
EXIT Realty Midwest
(712) 330-1805
9 in this area
57 Total Sales
-
Michael Jensen
Seller's Agent in 2024
Michael Jensen
Jensen Real Estate
(712) 320-7245
66 in this area
353 Total Sales
-
Jimy Mac Lenz
Seller's Agent in 2024
Jimy Mac Lenz
Hinn Real Estate
(712) 240-0695
3 in this area
56 Total Sales
Map
Source: Iowa Great Lakes Board of REALTORS®
MLS Number: 211000
APN: 07-21-352-055
Disclaimer: Certain information contained herein is derived from information provided by parties other than Homes.com. All information provided is deemed reliable, but is not guaranteed to be accurate and should be independently verified.
![]() IDX information is provided exclusively for personal, non-commercial use, and may not be used for any purpose other than to identify prospective properties consumers may be interested in purchasing. Information is deemed reliable but not guaranteed.
IDX information is provided exclusively for personal, non-commercial use, and may not be used for any purpose other than to identify prospective properties consumers may be interested in purchasing. Information is deemed reliable but not guaranteed.
Nearby Homes
- 290 240th Ave Unit 314
- 290 240th Ave Unit 297
- 290 240th Ave Unit 71
- 290 240th Ave Unit 23
- 290 240th Ave Unit 68
- 290 240th Ave Unit 21
- 290 240th Ave Unit 22
- 290 240th Ave Unit 261
- 290 240th Ave Unit 185
- 290 240th Ave Unit 65
- 290 240th Ave Unit 35
- 570 Linden Dr Unit 203
- 570 Linden Dr Unit 309
- 570 Linden Dr Unit 204
- 465 240th Ave Unit 107
- 435 240th Ave Unit 101
- 425 240th Ave Unit 300
- 425 240th Ave Unit 201
- 630 Linden Dr Unit 1117
- 630 Linden Dr Unit 1352