

290 240th Ave Arnolds Park, IA 51331
3
Beds
2
Baths
1,008
Sq Ft
5,264
Sq Ft Lot
Highlights
- Indoor Pool
- Exercise Course
- Eat-In Kitchen
- Vaulted Ceiling
- 1 Car Attached Garage
- Forced Air Heating and Cooling System
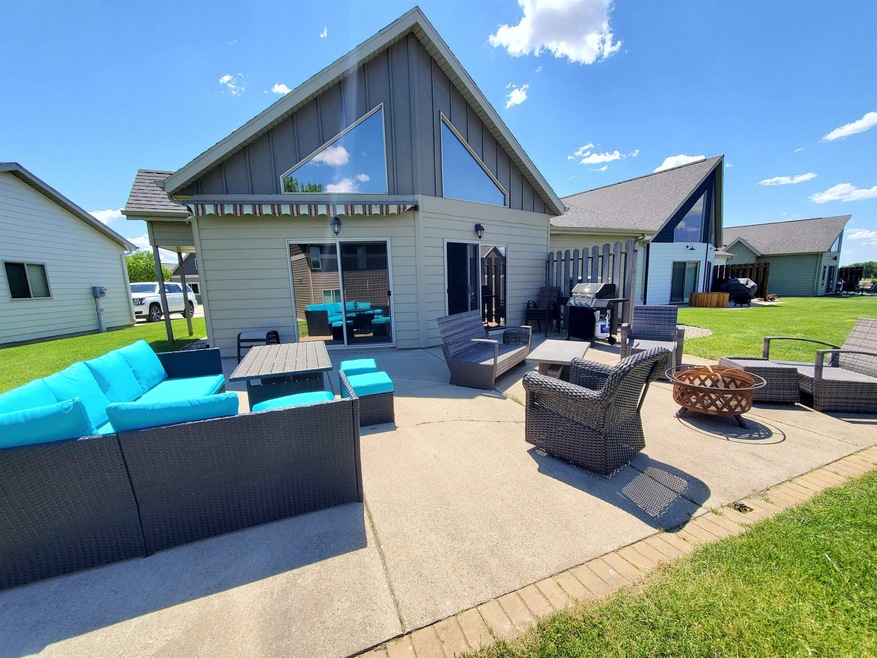
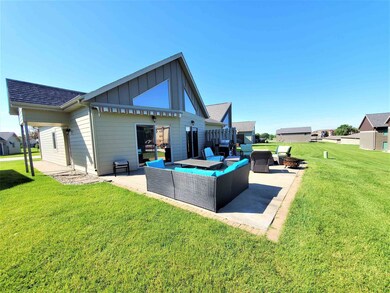
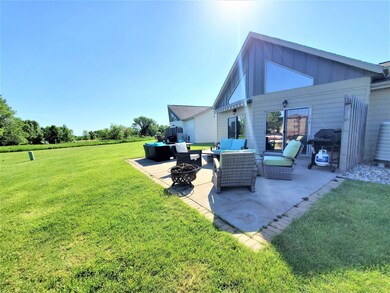
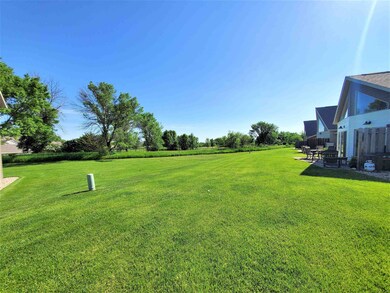
About This Home
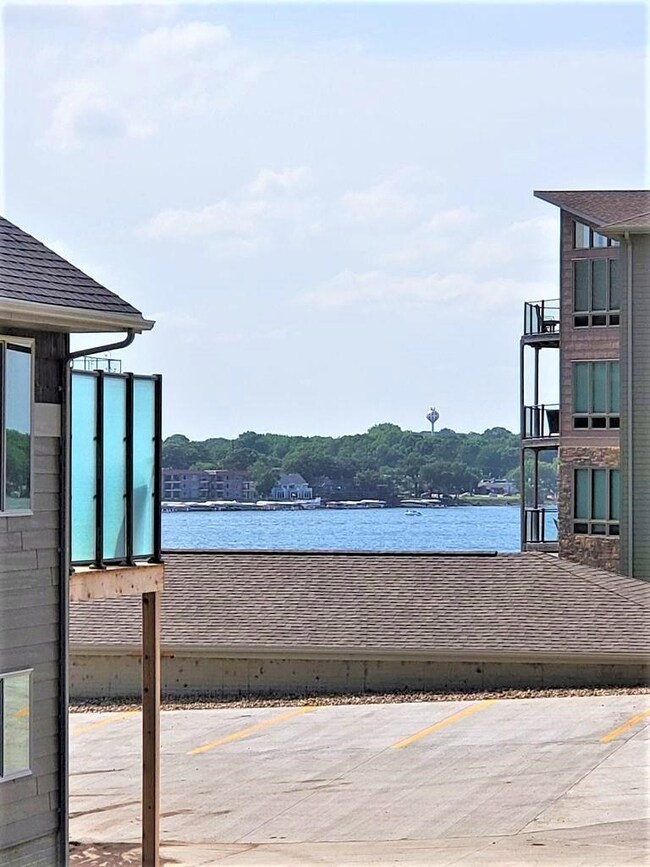
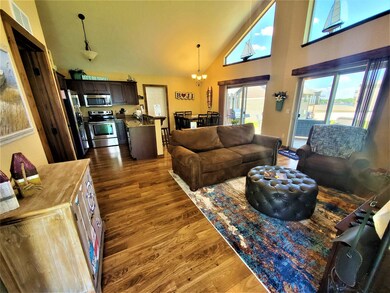
As of December 2024The opportunity to own a piece of Okoboji and make revenue at the same time! This three bedroom all one level cabin at Bridges Bay Resort is the perfect set up whether you are utilizing the property personally or as a vacation rental. Upgraded touches such as granite countertops and master on-suite bath with walk-in shower. The cabin is one of only a handful with a peek-a-boo East Lake view from the patio. Location in the complex is great across from the fishing pond and close to the entrance just a short walk to the main resort amenities and multiple pools. The cabin can be purchased turn key and would come with instant revenue for the 2023 season.
Last Agent to Sell the Property
Naatjes Group | Bluewater Brokers License #B60733 Listed on: 04/07/2023
Home Details
Home Type
- Single Family
Est. Annual Taxes
- $2,450
Year Built
- Built in 2009
Lot Details
- 5,264 Sq Ft Lot
- Sprinkler System
- TIF COMMON GROUND FOR UNIT 25 VACATION CABINS AT BRIDGES BAY RESORT
HOA Fees
- $267 Monthly HOA Fees
Parking
- 1 Car Attached Garage
- Garage Door Opener
- Driveway
Home Design
- Cabin
- Asphalt Roof
- Cement Siding
- Stick Built Home
Interior Spaces
- 1,008 Sq Ft Home
- 1-Story Property
- Furnished or left unfurnished upon request
- Vaulted Ceiling
- Ceiling Fan
- Window Treatments
- Tile Flooring
Kitchen
- Eat-In Kitchen
- Cooktop
- Microwave
- Freezer
- Dishwasher
- Kitchen Island
- Disposal
Bedrooms and Bathrooms
- 3 Bedrooms
- 2 Full Bathrooms
- Bathroom on Main Level
Laundry
- Laundry on main level
- Dryer
- Washer
Accessible Home Design
- No Interior Steps
- Accessible Pathway
Pool
- Indoor Pool
- In Ground Pool
- Spa
Additional Features
- Patio
- Forced Air Heating and Cooling System
Listing and Financial Details
- Assessor Parcel Number 0721352025, 0720500825
Community Details
Overview
- Association fees include exterior maint, lawn care, recreation facility, shared amenities, snow removal
- Bridges Bay Resort Subdivision
Amenities
- Recreation Room
Recreation
- Exercise Course
- Community Pool
Similar Homes in Arnolds Park, IA
Create a Home Valuation Report for This Property
The Home Valuation Report is an in-depth analysis detailing your home's value as well as a comparison with similar homes in the area
Home Values in the Area
Average Home Value in this Area
Property History
| Date | Event | Price | Change | Sq Ft Price |
|---|---|---|---|---|
| 07/06/2025 07/06/25 | For Sale | $429,000 | +15.9% | $261 / Sq Ft |
| 12/23/2024 12/23/24 | Sold | $370,000 | -25.2% | $320 / Sq Ft |
| 12/19/2024 12/19/24 | Sold | $494,900 | +33.8% | $271 / Sq Ft |
| 12/17/2024 12/17/24 | Pending | -- | -- | -- |
| 12/17/2024 12/17/24 | For Sale | $370,000 | -14.0% | $320 / Sq Ft |
| 12/12/2024 12/12/24 | Pending | -- | -- | -- |
| 11/08/2024 11/08/24 | Sold | $430,000 | -4.4% | $344 / Sq Ft |
| 11/01/2024 11/01/24 | Sold | $449,800 | -9.1% | $389 / Sq Ft |
| 10/29/2024 10/29/24 | For Sale | $494,900 | -10.0% | $271 / Sq Ft |
| 10/28/2024 10/28/24 | Sold | $550,000 | -11.9% | $260 / Sq Ft |
| 10/22/2024 10/22/24 | Pending | -- | -- | -- |
| 10/18/2024 10/18/24 | Sold | $624,000 | +45.1% | $233 / Sq Ft |
| 10/09/2024 10/09/24 | For Sale | $430,000 | -25.2% | $344 / Sq Ft |
| 10/08/2024 10/08/24 | Sold | $575,000 | +23.7% | $352 / Sq Ft |
| 09/24/2024 09/24/24 | Pending | -- | -- | -- |
| 09/20/2024 09/20/24 | Sold | $465,000 | +3.6% | $374 / Sq Ft |
| 09/12/2024 09/12/24 | For Sale | $448,900 | -29.3% | $389 / Sq Ft |
| 09/11/2024 09/11/24 | Pending | -- | -- | -- |
| 08/29/2024 08/29/24 | For Sale | $634,900 | +7.8% | $237 / Sq Ft |
| 08/28/2024 08/28/24 | For Sale | $589,000 | +0.7% | $361 / Sq Ft |
| 08/27/2024 08/27/24 | For Sale | $585,000 | +37.6% | $277 / Sq Ft |
| 08/09/2024 08/09/24 | Sold | $425,000 | +3.7% | $368 / Sq Ft |
| 07/29/2024 07/29/24 | Sold | $410,000 | -3.5% | $407 / Sq Ft |
| 07/27/2024 07/27/24 | Pending | -- | -- | -- |
| 07/25/2024 07/25/24 | Pending | -- | -- | -- |
| 07/16/2024 07/16/24 | For Sale | $425,000 | +1.2% | $368 / Sq Ft |
| 07/12/2024 07/12/24 | Sold | $420,000 | -12.4% | $364 / Sq Ft |
| 07/05/2024 07/05/24 | Price Changed | $479,500 | +39.0% | $385 / Sq Ft |
| 07/02/2024 07/02/24 | Sold | $345,000 | -18.8% | $379 / Sq Ft |
| 06/26/2024 06/26/24 | Pending | -- | -- | -- |
| 06/24/2024 06/24/24 | Price Changed | $425,000 | +7.6% | $422 / Sq Ft |
| 06/24/2024 06/24/24 | Pending | -- | -- | -- |
| 06/18/2024 06/18/24 | Sold | $395,000 | +11.3% | $342 / Sq Ft |
| 05/30/2024 05/30/24 | Price Changed | $354,900 | -2.7% | $390 / Sq Ft |
| 05/28/2024 05/28/24 | Price Changed | $364,900 | -12.1% | $401 / Sq Ft |
| 05/24/2024 05/24/24 | Pending | -- | -- | -- |
| 05/24/2024 05/24/24 | For Sale | $414,900 | -2.4% | $359 / Sq Ft |
| 05/24/2024 05/24/24 | For Sale | $424,900 | +13.3% | $368 / Sq Ft |
| 05/21/2024 05/21/24 | Price Changed | $374,900 | -20.2% | $412 / Sq Ft |
| 04/30/2024 04/30/24 | Sold | $470,000 | +17.8% | $282 / Sq Ft |
| 04/25/2024 04/25/24 | For Sale | $399,000 | -17.3% | $438 / Sq Ft |
| 03/27/2024 03/27/24 | Price Changed | $482,500 | +10.9% | $388 / Sq Ft |
| 03/21/2024 03/21/24 | For Sale | $435,000 | -10.3% | $432 / Sq Ft |
| 02/22/2024 02/22/24 | For Sale | $485,000 | 0.0% | $291 / Sq Ft |
| 02/22/2024 02/22/24 | For Sale | $485,000 | +14.1% | $390 / Sq Ft |
| 01/09/2024 01/09/24 | Pending | -- | -- | -- |
| 01/05/2024 01/05/24 | Sold | $425,000 | -5.3% | $310 / Sq Ft |
| 12/18/2023 12/18/23 | Pending | -- | -- | -- |
| 12/05/2023 12/05/23 | For Sale | $449,000 | -5.5% | $328 / Sq Ft |
| 11/17/2023 11/17/23 | Sold | $475,000 | +10.7% | $298 / Sq Ft |
| 09/06/2023 09/06/23 | Pending | -- | -- | -- |
| 07/10/2023 07/10/23 | Sold | $429,000 | -12.4% | $426 / Sq Ft |
| 05/12/2023 05/12/23 | For Sale | $489,900 | +14.2% | $307 / Sq Ft |
| 04/07/2023 04/07/23 | For Sale | $429,000 | -4.7% | $426 / Sq Ft |
| 03/29/2023 03/29/23 | Sold | $450,000 | 0.0% | $284 / Sq Ft |
| 02/01/2023 02/01/23 | Pending | -- | -- | -- |
| 01/25/2023 01/25/23 | For Sale | $450,000 | 0.0% | $284 / Sq Ft |
| 11/07/2022 11/07/22 | Rented | $1,600 | 0.0% | -- |
| 10/21/2022 10/21/22 | Sold | $459,000 | +4.3% | $270 / Sq Ft |
| 10/15/2022 10/15/22 | Pending | -- | -- | -- |
| 10/14/2022 10/14/22 | Sold | $440,000 | 0.0% | $313 / Sq Ft |
| 10/13/2022 10/13/22 | For Rent | $1,600 | 0.0% | -- |
| 09/28/2022 09/28/22 | Pending | -- | -- | -- |
| 09/07/2022 09/07/22 | For Sale | $459,000 | +0.9% | $270 / Sq Ft |
| 08/08/2022 08/08/22 | Price Changed | $455,000 | -3.2% | $324 / Sq Ft |
| 06/28/2022 06/28/22 | For Sale | $469,900 | +34.6% | $335 / Sq Ft |
| 04/08/2022 04/08/22 | Sold | $349,000 | -23.1% | $404 / Sq Ft |
| 03/31/2022 03/31/22 | Sold | $454,000 | +30.1% | $235 / Sq Ft |
| 03/04/2022 03/04/22 | Pending | -- | -- | -- |
| 02/27/2022 02/27/22 | For Sale | $349,000 | -24.9% | $404 / Sq Ft |
| 11/29/2021 11/29/21 | Pending | -- | -- | -- |
| 11/26/2021 11/26/21 | For Sale | $465,000 | +45.3% | $241 / Sq Ft |
| 11/05/2021 11/05/21 | Sold | $320,000 | -1.5% | $371 / Sq Ft |
| 09/07/2021 09/07/21 | For Sale | $324,900 | -1.5% | $376 / Sq Ft |
| 05/14/2021 05/14/21 | Sold | $330,000 | 0.0% | $208 / Sq Ft |
| 05/14/2021 05/14/21 | Pending | -- | -- | -- |
| 05/14/2021 05/14/21 | For Sale | $330,000 | +6.1% | $208 / Sq Ft |
| 03/05/2021 03/05/21 | Sold | $311,000 | +0.3% | $222 / Sq Ft |
| 01/22/2021 01/22/21 | Pending | -- | -- | -- |
| 01/10/2021 01/10/21 | For Sale | $310,000 | +5.1% | $221 / Sq Ft |
| 09/25/2020 09/25/20 | Sold | $295,000 | -1.3% | $255 / Sq Ft |
| 09/05/2020 09/05/20 | Pending | -- | -- | -- |
| 09/04/2020 09/04/20 | For Sale | $299,000 | +9.3% | $259 / Sq Ft |
| 08/10/2020 08/10/20 | Sold | $273,500 | -17.6% | $171 / Sq Ft |
| 08/10/2020 08/10/20 | Pending | -- | -- | -- |
| 04/17/2020 04/17/20 | Sold | $332,000 | +47.6% | $157 / Sq Ft |
| 04/17/2020 04/17/20 | Sold | $225,000 | -21.8% | $247 / Sq Ft |
| 04/13/2020 04/13/20 | Pending | -- | -- | -- |
| 04/09/2020 04/09/20 | For Sale | $287,900 | -14.0% | $180 / Sq Ft |
| 03/10/2020 03/10/20 | Pending | -- | -- | -- |
| 03/04/2020 03/04/20 | For Sale | $334,900 | +31.3% | $159 / Sq Ft |
| 09/25/2019 09/25/19 | Sold | $255,000 | 0.0% | $221 / Sq Ft |
| 09/25/2019 09/25/19 | Pending | -- | -- | -- |
| 09/25/2019 09/25/19 | For Sale | $255,000 | +3.2% | $221 / Sq Ft |
| 07/09/2019 07/09/19 | For Sale | $247,000 | +1.2% | $271 / Sq Ft |
| 03/08/2019 03/08/19 | Sold | $244,000 | +6.8% | $198 / Sq Ft |
| 02/20/2019 02/20/19 | Pending | -- | -- | -- |
| 01/17/2019 01/17/19 | Sold | $228,500 | -7.7% | $265 / Sq Ft |
| 01/14/2019 01/14/19 | For Sale | $247,500 | +5.3% | $201 / Sq Ft |
| 01/09/2019 01/09/19 | Pending | -- | -- | -- |
| 11/13/2018 11/13/18 | For Sale | $235,000 | -6.0% | $272 / Sq Ft |
| 07/13/2018 07/13/18 | Sold | $249,900 | 0.0% | $224 / Sq Ft |
| 07/12/2018 07/12/18 | Pending | -- | -- | -- |
| 07/12/2018 07/12/18 | For Sale | $249,900 | +4.1% | $224 / Sq Ft |
| 06/01/2018 06/01/18 | Sold | $240,000 | +0.8% | $167 / Sq Ft |
| 05/11/2018 05/11/18 | Pending | -- | -- | -- |
| 04/13/2018 04/13/18 | Sold | $238,000 | -6.6% | $191 / Sq Ft |
| 04/09/2018 04/09/18 | For Sale | $254,900 | +7.3% | $178 / Sq Ft |
| 04/06/2018 04/06/18 | Pending | -- | -- | -- |
| 02/06/2018 02/06/18 | For Sale | $237,500 | +13.1% | $191 / Sq Ft |
| 11/10/2017 11/10/17 | Sold | $210,000 | -4.1% | $181 / Sq Ft |
| 11/08/2017 11/08/17 | Pending | -- | -- | -- |
| 09/25/2017 09/25/17 | For Sale | $219,000 | -6.0% | $188 / Sq Ft |
| 06/23/2017 06/23/17 | Sold | $232,900 | -2.1% | $164 / Sq Ft |
| 06/21/2017 06/21/17 | Pending | -- | -- | -- |
| 06/15/2017 06/15/17 | Sold | $238,000 | +2.2% | $206 / Sq Ft |
| 06/07/2017 06/07/17 | Pending | -- | -- | -- |
| 05/03/2017 05/03/17 | For Sale | $232,900 | -4.9% | $164 / Sq Ft |
| 04/10/2017 04/10/17 | For Sale | $245,000 | +11.4% | $212 / Sq Ft |
| 12/28/2016 12/28/16 | Sold | $220,000 | 0.0% | $183 / Sq Ft |
| 12/20/2016 12/20/16 | Pending | -- | -- | -- |
| 10/26/2016 10/26/16 | For Sale | $219,900 | -- | $183 / Sq Ft |
Source: Iowa Great Lakes Board of REALTORS®
Tax History Compared to Growth
Tax History
| Year | Tax Paid | Tax Assessment Tax Assessment Total Assessment is a certain percentage of the fair market value that is determined by local assessors to be the total taxable value of land and additions on the property. | Land | Improvement |
|---|---|---|---|---|
| 2024 | $3,808 | $375,700 | $59,200 | $316,500 |
| 2023 | $2,648 | $374,900 | $58,400 | $316,500 |
| 2022 | $2,514 | $220,300 | $49,200 | $171,100 |
| 2021 | $2,514 | $222,100 | $51,000 | $171,100 |
| 2020 | $2,364 | $198,500 | $41,700 | $156,800 |
| 2019 | $2,308 | $198,500 | $41,700 | $156,800 |
| 2018 | $2,230 | $187,000 | $31,800 | $155,200 |
| 2017 | $2,230 | $187,100 | $31,900 | $155,200 |
| 2016 | $2,062 | $179,300 | $30,400 | $148,900 |
| 2015 | $1,982 | $179,400 | $30,500 | $148,900 |
| 2014 | $1,786 | $156,400 | $29,500 | $126,900 |
| 2013 | $1,676 | $156,700 | $29,800 | $126,900 |
Source: Public Records
Agents Affiliated with this Home
-
Abby Phillips
Seller's Agent in 2025
Abby Phillips
EXIT Realty Midwest
(712) 540-1356
49 Total Sales
-
Teresa Olson
Seller Co-Listing Agent in 2025
Teresa Olson
EXIT Realty Midwest
(712) 260-0402
7 in this area
7 Total Sales
-
Aaron Jones
Seller's Agent in 2024
Aaron Jones
RE/MAX
(712) 320-9442
125 in this area
317 Total Sales
-
Kolette Delperdang
Seller's Agent in 2024
Kolette Delperdang
EXIT Realty Midwest
(712) 330-1805
9 in this area
57 Total Sales
-
Michael Jensen
Seller's Agent in 2024
Michael Jensen
Jensen Real Estate
(712) 320-7245
66 in this area
353 Total Sales
-
Jimy Mac Lenz
Seller's Agent in 2024
Jimy Mac Lenz
Hinn Real Estate
(712) 240-0695
3 in this area
56 Total Sales
Map
Source: Iowa Great Lakes Board of REALTORS®
MLS Number: 230270
APN: 07-21-352-055
Disclaimer: Certain information contained herein is derived from information provided by parties other than Homes.com. All information provided is deemed reliable, but is not guaranteed to be accurate and should be independently verified.
![]() IDX information is provided exclusively for personal, non-commercial use, and may not be used for any purpose other than to identify prospective properties consumers may be interested in purchasing. Information is deemed reliable but not guaranteed.
IDX information is provided exclusively for personal, non-commercial use, and may not be used for any purpose other than to identify prospective properties consumers may be interested in purchasing. Information is deemed reliable but not guaranteed.
Nearby Homes
- 290 240th Ave Unit 314
- 290 240th Ave Unit 297
- 290 240th Ave Unit 71
- 290 240th Ave Unit 23
- 290 240th Ave Unit 68
- 290 240th Ave Unit 21
- 290 240th Ave Unit 22
- 290 240th Ave Unit 261
- 290 240th Ave Unit 185
- 290 240th Ave Unit 65
- 290 240th Ave Unit 35
- 570 Linden Dr Unit 203
- 570 Linden Dr Unit 309
- 570 Linden Dr Unit 204
- 465 240th Ave Unit 107
- 435 240th Ave Unit 101
- 425 240th Ave Unit 300
- 425 240th Ave Unit 201
- 630 Linden Dr Unit 1117
- 630 Linden Dr Unit 1352