290 Calef Hwy Epping, NH 03042
Studio
2
Baths
1,056
Sq Ft
1,191,802
Sq Ft Lot
About This Home
This home is located at 290 Calef Hwy, Epping, NH 03042. 290 Calef Hwy is a home located in Rockingham County with nearby schools including Epping Elementary School, Epping Middle School, and Epping High School.
Ownership History
Date
Name
Owned For
Owner Type
Purchase Details
Closed on
May 24, 2018
Sold by
Pine Cloutier and Par Pond Par
Bought by
Fraser Nancy A
Home Financials for this Owner
Home Financials are based on the most recent Mortgage that was taken out on this home.
Original Mortgage
$74,900
Outstanding Balance
$63,793
Interest Rate
4.4%
Mortgage Type
Unknown
Purchase Details
Closed on
Feb 28, 2017
Sold by
Aviso Olivette
Bought by
Olivette M Aviso Ft and Aviso
Purchase Details
Closed on
Nov 4, 2016
Sold by
Pineta Tina L
Bought by
Anderson Leo F
Home Financials for this Owner
Home Financials are based on the most recent Mortgage that was taken out on this home.
Original Mortgage
$27,000
Interest Rate
3.48%
Mortgage Type
Unknown
Purchase Details
Closed on
Sep 30, 2016
Sold by
Maddock Walter
Bought by
Morehouse Beatrice A
Home Financials for this Owner
Home Financials are based on the most recent Mortgage that was taken out on this home.
Original Mortgage
$27,000
Interest Rate
3.48%
Mortgage Type
Unknown
Purchase Details
Closed on
Jul 1, 2015
Sold by
Murphy Ft
Bought by
Bernier Marie M
Purchase Details
Closed on
Jul 23, 2014
Sold by
Sandra L Dennis Ret and Dennis
Bought by
Sandra L Dennis Ret and Dennis
Purchase Details
Closed on
May 7, 2013
Sold by
Krebs Henry S
Bought by
Pine & Pond Inc
Purchase Details
Closed on
Apr 23, 2013
Sold by
Pine & Pond Inc
Bought by
Connors Mary E and Connors Christopher
Purchase Details
Closed on
Apr 30, 2012
Sold by
Rosado Lillian
Bought by
Dennis Sandra L
Purchase Details
Closed on
Feb 15, 2012
Sold by
Blatchford Shirley L
Bought by
Shirley L Blatchford R L and Shirley Lawrence
Purchase Details
Closed on
Nov 30, 2010
Sold by
Taatjes Marjorie
Bought by
Rogers Cheryl A
Purchase Details
Closed on
Oct 29, 2010
Sold by
Amazeen Frank E and Amazeen Isabel S
Bought by
Meagher Gary
Purchase Details
Closed on
Aug 23, 2010
Sold by
Demos Jimmie Jean
Bought by
Pine & Pond Inc
Purchase Details
Closed on
Aug 3, 2010
Sold by
Warren Pearl B
Bought by
Dobe Dauna L
Purchase Details
Closed on
Jul 22, 2010
Sold by
Harrison William G
Bought by
Cotreau Lois Elaine
Purchase Details
Closed on
Feb 2, 2010
Sold by
Novell Beverly J Est
Bought by
Hewson Judith C
Purchase Details
Closed on
Dec 23, 2009
Sold by
Rogers Judith A
Bought by
Berube John W
Purchase Details
Closed on
Nov 10, 2009
Sold by
Spencer Jerald L
Bought by
Pine & Pond Inc
Purchase Details
Closed on
Oct 28, 2009
Sold by
Kershaw Florence A and Kershaw Edward W
Bought by
Lister Richard and Lister Nancy T
Purchase Details
Closed on
Mar 16, 2009
Sold by
Sylvester Barbara E
Bought by
Dow Arnold R and Dow Alberta L
Purchase Details
Closed on
Feb 24, 2009
Sold by
Lamothe Andre L and Lamothe Shirlie B
Bought by
Wain Joanne T
Purchase Details
Closed on
Sep 23, 2008
Sold by
Ondus Martha
Bought by
Rosado Lillian
Create a Home Valuation Report for This Property
The Home Valuation Report is an in-depth analysis detailing your home's value as well as a comparison with similar homes in the area
Home Values in the Area
Average Home Value in this Area
Purchase History
| Date | Buyer | Sale Price | Title Company |
|---|---|---|---|
| Fraser Nancy A | $114,933 | -- | |
| Olivette M Aviso Ft | -- | -- | |
| Olivette M Aviso Ft | -- | -- | |
| Olivette M Aviso Ft | -- | -- | |
| Anderson Leo F | $30,000 | -- | |
| Anderson Leo F | $30,000 | -- | |
| Anderson Leo F | $30,000 | -- | |
| Morehouse Beatrice A | -- | -- | |
| Aviso Olivette | $48,533 | -- | |
| Aviso Olivette | $48,533 | -- | |
| Morehouse Beatrice A | -- | -- | |
| Morehouse Beatrice A | -- | -- | |
| Morehouse Beatrice A | -- | -- | |
| Morehouse Beatrice A | -- | -- | |
| Bernier Marie M | $95,000 | -- | |
| Bernier Marie M | $95,000 | -- | |
| Sandra L Dennis Ret | -- | -- | |
| Pine & Pond Inc | $20,000 | -- | |
| Pine & Pond Inc | $20,000 | -- | |
| Connors Mary E | $28,000 | -- | |
| Connors Mary E | $28,000 | -- | |
| Dennis Sandra L | $70,000 | -- | |
| Dennis Sandra L | $70,000 | -- | |
| Shirley L Blatchford R L | -- | -- | |
| Shirley L Blatchford R | -- | -- | |
| Rogers Cheryl A | $20,000 | -- | |
| Rogers Cheryl A | $20,000 | -- | |
| Meagher Gary | $23,500 | -- | |
| Meagher Gary | $23,500 | -- | |
| Pine & Pond Inc | $9,500 | -- | |
| Pine & Pond Inc | $9,500 | -- | |
| Dobe Dauna L | $42,000 | -- | |
| Dobe Dauna L | $42,000 | -- | |
| Cotreau Lois Elaine | $15,000 | -- | |
| Cotreau Lois Elaine | $15,000 | -- | |
| Hewson Judith C | $11,800 | -- | |
| Hewson Judith C | $11,800 | -- | |
| Hewson Judith C | $11,800 | -- | |
| Berube John W | $25,000 | -- | |
| Berube John W | $25,000 | -- | |
| Pine & Pond Inc | $10,000 | -- | |
| Pine & Pond Inc | $10,000 | -- | |
| Lister Richard | $60,000 | -- | |
| Lister Richard V | $60,000 | -- | |
| Dow Arnold R | $22,000 | -- | |
| Dow Arnold R | $22,000 | -- | |
| Wain Joanne T | $120,000 | -- | |
| Wain Joanne T | $120,000 | -- | |
| Rosado Lillian | $90,000 | -- | |
| Rosado Lillian | $90,000 | -- |
Source: Public Records
Mortgage History
| Date | Status | Borrower | Loan Amount |
|---|---|---|---|
| Open | Fraser Nancy A | $74,900 | |
| Previous Owner | Anderson Leo F | $27,000 |
Source: Public Records
Tax History
| Year | Tax Paid | Tax Assessment Tax Assessment Total Assessment is a certain percentage of the fair market value that is determined by local assessors to be the total taxable value of land and additions on the property. | Land | Improvement |
|---|---|---|---|---|
| 2024 | $106,135 | $4,206,700 | $1,800,900 | $2,405,800 |
| 2023 | $98,371 | $4,203,900 | $1,800,900 | $2,403,000 |
| 2022 | $94,546 | $4,203,900 | $1,800,900 | $2,403,000 |
| 2021 | $94,251 | $4,203,900 | $1,800,900 | $2,403,000 |
| 2020 | $3,432 | $4,203,900 | $1,800,900 | $2,403,000 |
| 2019 | $64,264 | $2,320,000 | $1,607,000 | $713,000 |
| 2018 | $60,181 | $2,320,000 | $1,607,000 | $713,000 |
| 2017 | $60,181 | $2,320,000 | $1,607,000 | $713,000 |
| 2016 | $60,181 | $2,320,000 | $1,607,000 | $713,000 |
| 2015 | $64,570 | $2,489,200 | $1,619,900 | $869,300 |
| 2014 | $61,050 | $2,500,000 | $1,619,900 | $880,100 |
| 2013 | $60,675 | $2,500,000 | $1,619,900 | $880,100 |
Source: Public Records
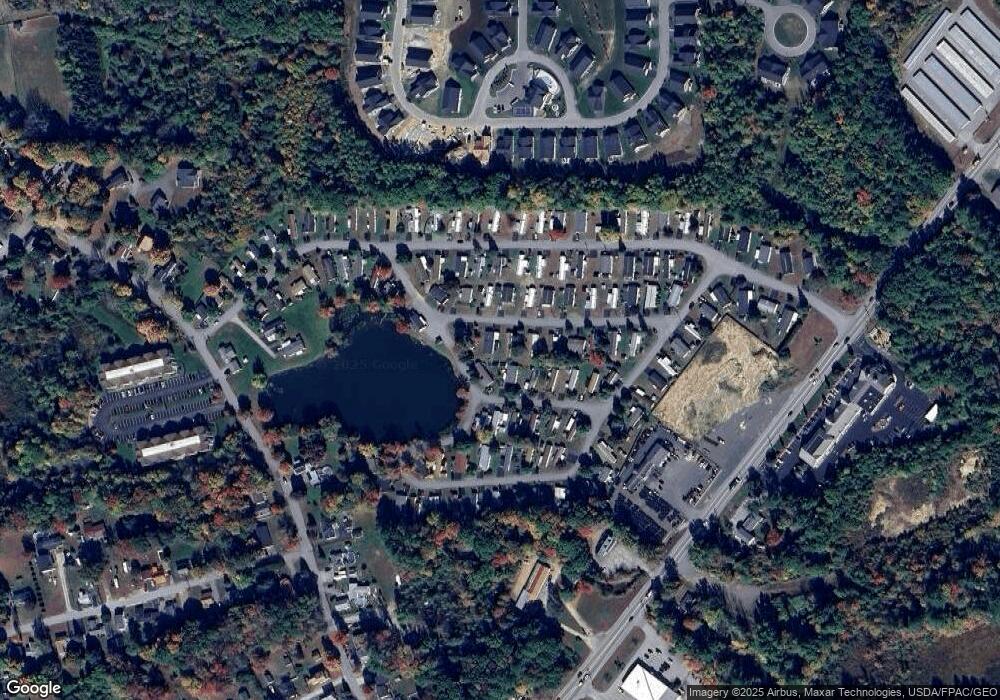
Map
Nearby Homes
- 290 Calef Hwy Unit B21
- 13 Elm St
- 27 Mulberry Ln
- 2 Prescott Rd
- 23 Old Stage Coach Rd Unit 8
- 16B Lunas Ave Unit 16B
- 5A Connor Ct Unit 5A
- 46 Dorothy Dr
- 5 Hedding Rd
- 153 Coffin Rd Unit 22
- 153 Coffin Rd Unit 19
- 153 Coffin Rd Unit 24
- 1B Connor Ct Unit 1B
- 1A Connor Ct Unit 1A
- 65 Sunset Ridge Rd Unit 65A
- 65 Sunset Ridge Rd Unit 65B
- 63 Sunset Ridge Rd Unit 63A
- 63 Sunset Ridge Rd Unit 63B
- 3A Connor Ct Unit 3A
- 55 Sunset Ridge Rd Unit 55A
- 290 Calef Hwy Unit C7
- 290 Calef Hwy Unit C-21
- 276 Route 125
- 290 Calef Hwy Unit Lot 25A
- 290 Calef Hwy Unit 25A
- 290 Calef Hwy Unit C-28
- 290 Calef Hwy Unit C18
- 290 Calef Hwy Unit B15
- 290 Calef Hwy
- 290 Calef Hwy Unit B8
- 290 Calef Hwy Unit D21
- 290 Calef Hwy Unit D25
- 290 Calef Hwy Unit B16
- 290 Calef Hwy Unit B1
- 290 Calef Hwy Unit C2
- 290 Calef Hwy Unit C10
- 290 Calef Hwy Unit A-17
- 290 Calef Hwy Unit C16A
- 290 Calef Hwy Unit D26
- 290 Calef Hwy
Your Personal Tour Guide
Ask me questions while you tour the home.