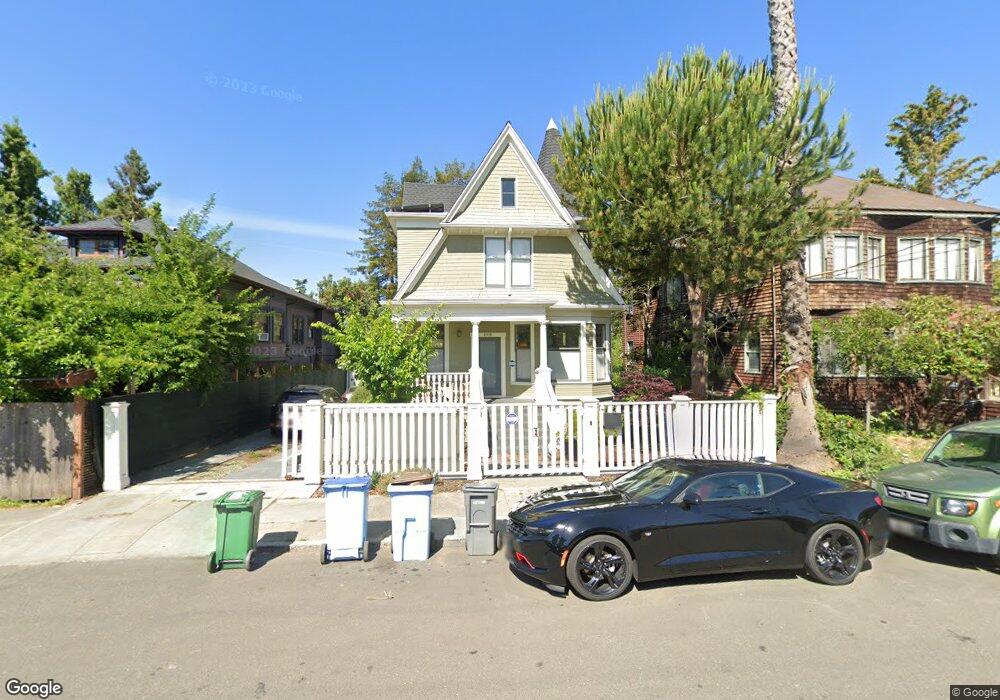
2918 Ellsworth St Berkeley, CA 94705
South Berkeley NeighborhoodEstimated Value: $2,146,000 - $2,519,000
4
Beds
4
Baths
2,263
Sq Ft
$1,042/Sq Ft
Est. Value
About This Home
This home is located at 2918 Ellsworth St, Berkeley, CA 94705 and is currently estimated at $2,358,786, approximately $1,042 per square foot. 2918 Ellsworth St is a home located in Alameda County with nearby schools including Emerson Elementary School, Malcolm X Elementary School, and John Muir Elementary School.
Ownership History
Date
Name
Owned For
Owner Type
Purchase Details
Closed on
Jul 12, 2017
Sold by
Equity Track Llc
Bought by
Pienaar Andrew and Pienaar Cathleen
Current Estimated Value
Home Financials for this Owner
Home Financials are based on the most recent Mortgage that was taken out on this home.
Original Mortgage
$1,080,000
Outstanding Balance
$877,656
Interest Rate
3.12%
Mortgage Type
Commercial
Estimated Equity
$1,481,130
Purchase Details
Closed on
Jul 28, 2015
Sold by
Rhine Rebecca
Bought by
Equity Track Llc
Home Financials for this Owner
Home Financials are based on the most recent Mortgage that was taken out on this home.
Original Mortgage
$792,000
Interest Rate
3.98%
Mortgage Type
Commercial
Purchase Details
Closed on
Mar 25, 2015
Sold by
Livin Rhine Rebecca and Livin Keith Assender Revocable
Bought by
Rhine Rebecca
Purchase Details
Closed on
Jun 29, 2012
Sold by
Assender Keith
Bought by
Assender Keith and The Keith Assender Revocable L
Purchase Details
Closed on
Jun 22, 1999
Sold by
Assender Keith
Bought by
Assender Keith and Keith Assender Revocable Trust
Create a Home Valuation Report for This Property
The Home Valuation Report is an in-depth analysis detailing your home's value as well as a comparison with similar homes in the area
Home Values in the Area
Average Home Value in this Area
Purchase History
| Date | Buyer | Sale Price | Title Company |
|---|---|---|---|
| Pienaar Andrew | $1,800,000 | North American Title Co Inc | |
| Equity Track Llc | $1,100,000 | Placer Title Company | |
| Rhine Rebecca | -- | None Available | |
| Assender Keith | -- | None Available | |
| Assender Keith | -- | None Available | |
| Assender Keith | -- | -- |
Source: Public Records
Mortgage History
| Date | Status | Borrower | Loan Amount |
|---|---|---|---|
| Open | Pienaar Andrew | $1,080,000 | |
| Previous Owner | Equity Track Llc | $792,000 |
Source: Public Records
Tax History
| Year | Tax Paid | Tax Assessment Tax Assessment Total Assessment is a certain percentage of the fair market value that is determined by local assessors to be the total taxable value of land and additions on the property. | Land | Improvement |
|---|---|---|---|---|
| 2025 | $29,946 | $2,041,057 | $614,417 | $1,433,640 |
| 2024 | $29,946 | $2,000,900 | $602,370 | $1,405,530 |
| 2023 | $29,340 | $1,968,533 | $590,560 | $1,377,973 |
| 2022 | $28,843 | $1,922,941 | $578,982 | $1,350,959 |
| 2021 | $28,937 | $1,885,105 | $567,631 | $1,324,474 |
| 2020 | $27,428 | $1,872,720 | $561,816 | $1,310,904 |
| 2019 | $26,405 | $1,836,000 | $550,800 | $1,285,200 |
| 2018 | $25,981 | $1,800,000 | $540,000 | $1,260,000 |
| 2017 | $17,505 | $1,122,000 | $459,000 | $663,000 |
| 2016 | $16,870 | $1,100,000 | $450,000 | $650,000 |
| 2015 | $5,364 | $169,621 | $120,243 | $49,378 |
| 2014 | -- | $166,299 | $117,888 | $48,411 |
Source: Public Records
Map
Nearby Homes
- 2243 Ashby Ave
- 2923 Wheeler St
- 2917 Telegraph Ave
- 3046 Deakin St
- 2319 Ward St
- 2935 Florence St
- 2110 Ashby Ave
- 2702 Dana St
- 2124 Prince St
- 2057 Emerson St
- 629 66th St
- 2477 Prince St
- 6445 Irwin Ct
- 6446 Colby St
- 2550 Dana St Unit 2F
- 2535 Chilton Way
- 6555 Shattuck Ave
- 556 Alcatraz Ave
- 2643 Stuart St
- 2018 Blake St
- 2928 Ellsworth St
- 2914 Ellsworth St
- 2932 Ellsworth St
- 2934 Ellsworth St
- 2936 Ellsworth St
- 2919 Deakin St
- 2921 Deakin St
- 2915 Deakin St
- 2300 Howe St
- 2906 Ellsworth St
- 2925 Deakin St
- 2927 Deakin St
- 2245 Ashby Ave
- 2238 Russell St
- 2304 Howe St
- 2247 Ashby Ave
- 2925 Ellsworth St
- 2235 Ashby Ave
- 2244 Russell St
- 2303 Howe St
Your Personal Tour Guide
Ask me questions while you tour the home.