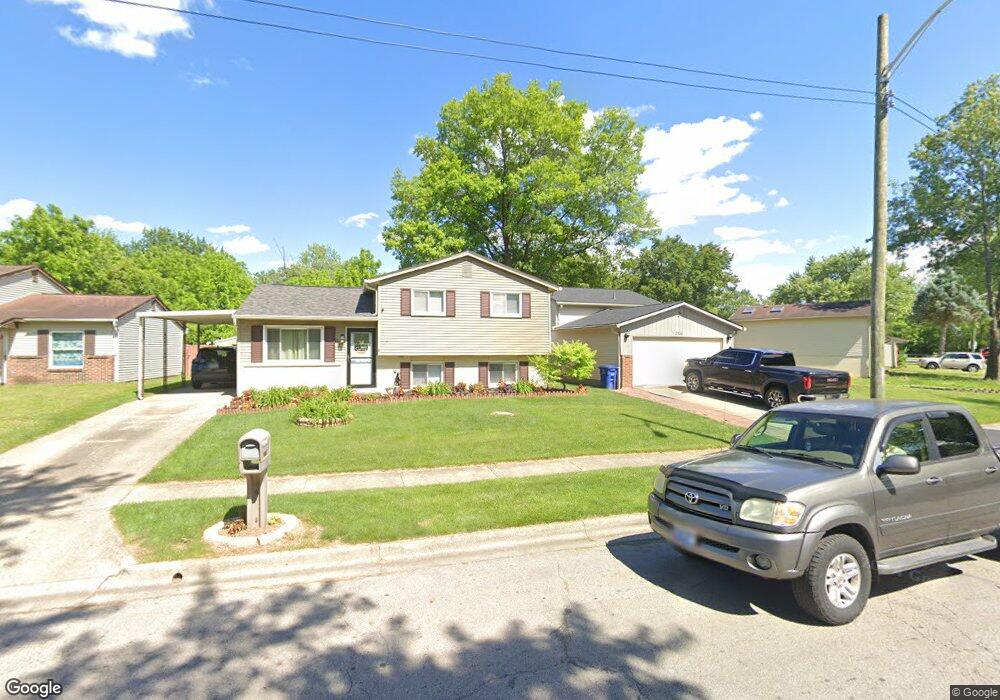
2922 Falcon Bridge Dr Columbus, OH 43232
Walnut Heights NeighborhoodEstimated Value: $221,000 - $240,000
3
Beds
2
Baths
1,350
Sq Ft
$170/Sq Ft
Est. Value
About This Home
This home is located at 2922 Falcon Bridge Dr, Columbus, OH 43232 and is currently estimated at $230,086, approximately $170 per square foot. 2922 Falcon Bridge Dr is a home located in Franklin County with nearby schools including Liberty Elementary School, Yorktown Middle School, and Independence High School.
Ownership History
Date
Name
Owned For
Owner Type
Purchase Details
Closed on
Mar 24, 2004
Sold by
Kauff Stephen P and Kauff Amanda L
Bought by
Burnette Gregory J and Burnette Jessica M
Current Estimated Value
Home Financials for this Owner
Home Financials are based on the most recent Mortgage that was taken out on this home.
Original Mortgage
$99,017
Interest Rate
5.65%
Mortgage Type
FHA
Purchase Details
Closed on
Aug 2, 1995
Sold by
Richards Joseph T
Bought by
Kauf Stephen P and Kauf Amanda L
Home Financials for this Owner
Home Financials are based on the most recent Mortgage that was taken out on this home.
Original Mortgage
$70,278
Interest Rate
7.56%
Mortgage Type
VA
Purchase Details
Closed on
Jul 24, 1987
Create a Home Valuation Report for This Property
The Home Valuation Report is an in-depth analysis detailing your home's value as well as a comparison with similar homes in the area
Home Values in the Area
Average Home Value in this Area
Purchase History
| Date | Buyer | Sale Price | Title Company |
|---|---|---|---|
| Burnette Gregory J | $99,900 | Lawyers Title | |
| Kauf Stephen P | $70,278 | -- | |
| -- | $51,900 | -- |
Source: Public Records
Mortgage History
| Date | Status | Borrower | Loan Amount |
|---|---|---|---|
| Previous Owner | Burnette Gregory J | $99,017 | |
| Previous Owner | Kauf Stephen P | $70,278 |
Source: Public Records
Tax History Compared to Growth
Tax History
| Year | Tax Paid | Tax Assessment Tax Assessment Total Assessment is a certain percentage of the fair market value that is determined by local assessors to be the total taxable value of land and additions on the property. | Land | Improvement |
|---|---|---|---|---|
| 2024 | $2,820 | $62,830 | $19,180 | $43,650 |
| 2023 | $2,784 | $62,825 | $19,180 | $43,645 |
| 2022 | $1,857 | $35,810 | $5,950 | $29,860 |
| 2021 | $1,861 | $35,810 | $5,950 | $29,860 |
| 2020 | $1,863 | $35,810 | $5,950 | $29,860 |
| 2019 | $1,837 | $30,280 | $4,940 | $25,340 |
| 2018 | $1,733 | $30,280 | $4,940 | $25,340 |
| 2017 | $1,836 | $30,280 | $4,940 | $25,340 |
| 2016 | $1,799 | $27,160 | $5,040 | $22,120 |
| 2015 | $1,633 | $27,160 | $5,040 | $22,120 |
| 2014 | $1,637 | $27,160 | $5,040 | $22,120 |
| 2013 | $897 | $30,170 | $5,600 | $24,570 |
Source: Public Records
Map
Nearby Homes
- 5377 Bleaker Ave
- 5401 Spire Ln
- 5373 Spire Ln
- 5278 Glenbriar Ct
- 2998 Osgood Rd E
- 2730 Raphael Dr
- 5137 Holbrook Dr
- 3148 Aldgate St
- 2744 Barrows Rd
- 2736 Barrows Rd
- 2991 Blue Moon Dr
- 2651 Brownfield Rd
- 3198 Gallant Dr
- 5125 Upton Rd N
- 5011 Refugee Rd
- 5268 Carbondale Dr
- 5882 Abernathy Ln Unit 5882F
- 3289 Kady Ln
- 5323 Sundale Place S
- 5936 Abernathy Ln
- 2930 Falcon Bridge Dr
- 2916 Falcon Bridge Dr
- 2938 Falcon Bridge Dr
- 2910 Falcon Bridge Dr
- 2946 Falcon Bridge Dr
- 2925 Adderley Ave
- 2906 Falcon Bridge Dr
- 2933 Thornell Way
- 2925 Thornell Way
- 2952 Falcon Bridge Dr
- 2917 Falcon Bridge Dr
- 2902 Falcon Bridge Dr
- 2911 Falcon Bridge Dr
- 2931 Falcon Bridge Dr
- 5326 Adderley Ave
- 2903 Falcon Bridge Dr
- 2958 Falcon Bridge Dr
- 2939 Falcon Bridge Dr
- 2941 Thornell Way
- 2898 Falcon Bridge Dr