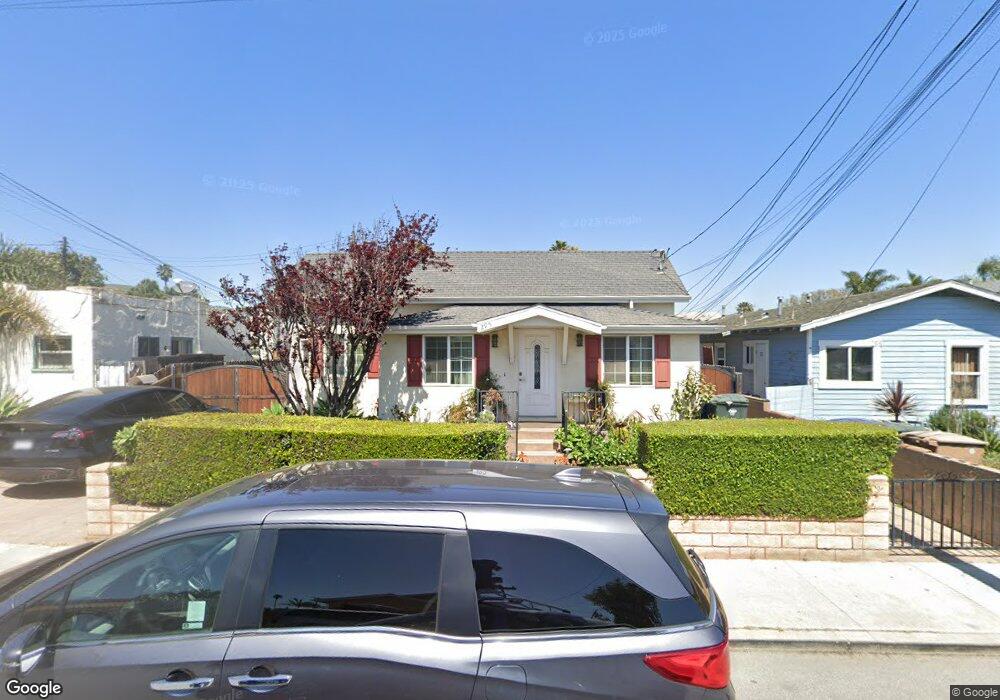
295 W Harrison Ave Ventura, CA 93001
Westside NeighborhoodEstimated Value: $1,063,658 - $1,496,000
3
Beds
3
Baths
1,785
Sq Ft
$686/Sq Ft
Est. Value
About This Home
This home is located at 295 W Harrison Ave, Ventura, CA 93001 and is currently estimated at $1,224,915, approximately $686 per square foot. 295 W Harrison Ave is a home located in Ventura County with nearby schools including Will Rogers Elementary School, De Anza Academy Of Technology And The Arts, and Ventura High School.
Ownership History
Date
Name
Owned For
Owner Type
Purchase Details
Closed on
Dec 2, 2005
Sold by
Ali Syed M
Bought by
Ali Syed M and Ali Rehana
Current Estimated Value
Home Financials for this Owner
Home Financials are based on the most recent Mortgage that was taken out on this home.
Original Mortgage
$375,000
Outstanding Balance
$210,811
Interest Rate
6.37%
Mortgage Type
Purchase Money Mortgage
Estimated Equity
$1,014,104
Purchase Details
Closed on
Apr 12, 2004
Sold by
Ali Rehana
Bought by
Ali Syed M
Home Financials for this Owner
Home Financials are based on the most recent Mortgage that was taken out on this home.
Original Mortgage
$275,000
Interest Rate
6.25%
Mortgage Type
New Conventional
Purchase Details
Closed on
Feb 14, 2002
Sold by
Baker Laura C
Bought by
Ali Syed M and Ali Rehana
Home Financials for this Owner
Home Financials are based on the most recent Mortgage that was taken out on this home.
Original Mortgage
$171,000
Interest Rate
8.5%
Purchase Details
Closed on
Oct 1, 1999
Sold by
Klemm Richard L and Klemm Gwenda S
Bought by
Baker Laura C
Home Financials for this Owner
Home Financials are based on the most recent Mortgage that was taken out on this home.
Original Mortgage
$124,000
Interest Rate
7.95%
Create a Home Valuation Report for This Property
The Home Valuation Report is an in-depth analysis detailing your home's value as well as a comparison with similar homes in the area
Home Values in the Area
Average Home Value in this Area
Purchase History
| Date | Buyer | Sale Price | Title Company |
|---|---|---|---|
| Ali Syed M | -- | Chicago Title Company | |
| Ali Syed M | -- | Fidelity National Title Co | |
| Ali Syed M | $190,000 | Fidelity National Title Co | |
| Baker Laura C | $155,000 | American Title Co |
Source: Public Records
Mortgage History
| Date | Status | Borrower | Loan Amount |
|---|---|---|---|
| Open | Ali Syed M | $375,000 | |
| Closed | Ali Syed M | $275,000 | |
| Closed | Ali Syed M | $171,000 | |
| Previous Owner | Baker Laura C | $124,000 |
Source: Public Records
Tax History
| Year | Tax Paid | Tax Assessment Tax Assessment Total Assessment is a certain percentage of the fair market value that is determined by local assessors to be the total taxable value of land and additions on the property. | Land | Improvement |
|---|---|---|---|---|
| 2025 | $4,760 | $441,548 | $295,452 | $146,096 |
| 2024 | $4,760 | $432,891 | $289,659 | $143,232 |
| 2023 | $4,701 | $424,403 | $283,979 | $140,424 |
| 2022 | $4,380 | $416,082 | $278,411 | $137,671 |
| 2021 | $4,295 | $407,924 | $272,952 | $134,972 |
| 2020 | $4,254 | $403,743 | $270,154 | $133,589 |
| 2019 | $4,175 | $395,827 | $264,857 | $130,970 |
| 2018 | $4,105 | $388,066 | $259,664 | $128,402 |
| 2017 | $4,018 | $380,458 | $254,573 | $125,885 |
| 2016 | $3,939 | $372,999 | $249,582 | $123,417 |
| 2015 | $3,897 | $367,398 | $245,834 | $121,564 |
| 2014 | $3,847 | $360,203 | $241,019 | $119,184 |
Source: Public Records
Map
Nearby Homes
- 335 W Simpson St
- 161 N Garden St
- 61 W Center St
- 161 N Garden
- 285 N Ventura Ave Unit 5
- 320 N Ventura Ave
- 130 N Garden St Unit 2224
- 130 N Garden St Unit 1103
- 323 Wall St
- 57 E Center St
- 557 561 N North Olive St
- 281 W Main St
- 531 Cedar St
- 885 Riverside St
- 852 N Ventura Ave
- 0 Cedar St Unit PW26050306
- 148 Beach Side Ct
- 212 E Barnett St
- 201 S Olive St
- 121 E Warner St
- 285 W Harrison Ave
- 303 W Harrison Ave
- 277 W Harrison Ave
- 275 W Harrison Ave
- 325 W Harrison Ave
- 265 W Harrison Ave
- 333 W Harrison Ave
- 294 W Prospect St
- 304 W Prospect St
- 282 W Prospect St
- 314 W Prospect St
- 270 W Prospect St
- 255 W Harrison Ave
- 345 W Harrison Ave
- 294 W Harrison Ave
- 324 W Prospect St
- 306 W Harrison Ave
- 260 W Prospect St
- 318 W Harrison Ave
- 272 W Harrison Ave
Your Personal Tour Guide
Ask me questions while you tour the home.