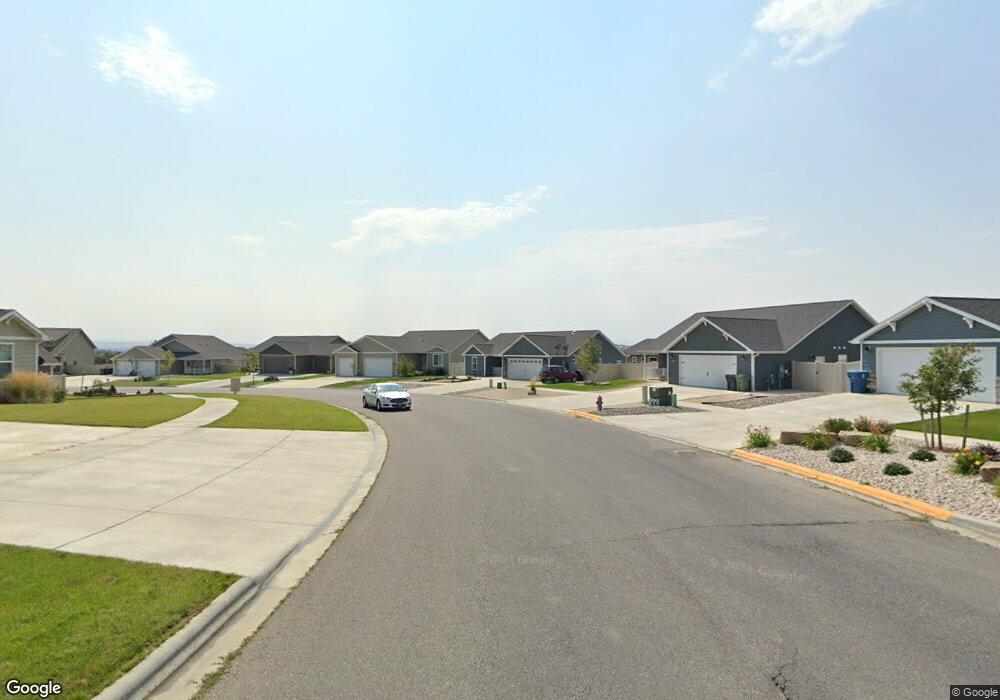
2950 W Copper Ridge Loop Billings, MT 59106
West Shiloh NeighborhoodEstimated Value: $413,000 - $494,000
3
Beds
2
Baths
1,438
Sq Ft
$304/Sq Ft
Est. Value
About This Home
This home is located at 2950 W Copper Ridge Loop, Billings, MT 59106 and is currently estimated at $437,286, approximately $304 per square foot. 2950 W Copper Ridge Loop is a home located in Yellowstone County with nearby schools including Boulder School, Ben Steele Middle School, and Billings West High School.
Ownership History
Date
Name
Owned For
Owner Type
Purchase Details
Closed on
Jul 5, 2024
Sold by
Miller John and Miller Colleen
Bought by
Robey Gregory A and Robey Karen L
Current Estimated Value
Home Financials for this Owner
Home Financials are based on the most recent Mortgage that was taken out on this home.
Original Mortgage
$421,397
Outstanding Balance
$416,402
Interest Rate
7.03%
Mortgage Type
New Conventional
Estimated Equity
$20,884
Purchase Details
Closed on
Feb 21, 2018
Sold by
Yu Chong C
Bought by
Miller John and Miller Colleen
Purchase Details
Closed on
Nov 17, 2015
Sold by
Oakland Built Homes Inc
Bought by
Cha Yu Chong
Home Financials for this Owner
Home Financials are based on the most recent Mortgage that was taken out on this home.
Original Mortgage
$193,500
Interest Rate
3.73%
Mortgage Type
New Conventional
Purchase Details
Closed on
Mar 13, 2015
Sold by
Copper Ridge Development Corp
Bought by
Oakland Built Homes Inc
Create a Home Valuation Report for This Property
The Home Valuation Report is an in-depth analysis detailing your home's value as well as a comparison with similar homes in the area
Home Values in the Area
Average Home Value in this Area
Purchase History
| Date | Buyer | Sale Price | Title Company |
|---|---|---|---|
| Robey Gregory A | -- | Chicago Title | |
| Miller John | -- | -- | |
| Cha Yu Chong | -- | Chicago Title | |
| Oakland Built Homes Inc | -- | Chicago Title |
Source: Public Records
Mortgage History
| Date | Status | Borrower | Loan Amount |
|---|---|---|---|
| Open | Robey Gregory A | $421,397 | |
| Previous Owner | Cha Yu Chong | $193,500 |
Source: Public Records
Tax History Compared to Growth
Tax History
| Year | Tax Paid | Tax Assessment Tax Assessment Total Assessment is a certain percentage of the fair market value that is determined by local assessors to be the total taxable value of land and additions on the property. | Land | Improvement |
|---|---|---|---|---|
| 2025 | $3,754 | $406,300 | $85,118 | $321,182 |
| 2024 | $3,754 | $349,800 | $69,316 | $280,484 |
| 2023 | $3,714 | $349,800 | $69,316 | $280,484 |
| 2022 | $2,575 | $272,800 | $0 | $0 |
| 2021 | $3,085 | $272,800 | $0 | $0 |
| 2020 | $3,047 | $258,100 | $0 | $0 |
| 2019 | $2,924 | $258,100 | $0 | $0 |
| 2018 | $2,677 | $249,600 | $0 | $0 |
| 2017 | $2,648 | $254,500 | $0 | $0 |
| 2016 | $2,400 | $230,800 | $0 | $0 |
| 2015 | $550 | $59,346 | $0 | $0 |
Source: Public Records
Map
Nearby Homes
- 2981 W Copper Ridge Loop
- 7038 Copper Sunset Dr
- 7031 Copper Sunset Dr
- 7024 Copper Bend Blvd
- 7050 Copper Sunset Dr
- Torrey Plan at Copper Ridge
- 7036 Copper Bend Blvd
- 7042 Copper Bend Blvd
- 6730 Cove Creek Dr
- 635 Willow Branch Rd
- 637 Willow Branch Rd
- 3136 Amelia Cir
- 3111 Amelia Cir
- 6424 Southern Bluffs Ln
- 6421 Southern Bluffs Ln Unit 2
- 6421 Southern Bluffs Ln Unit 1
- 6333 Stream Bank
- 1226 Buffalo Crossing Dr
- 6325 Beckville Ln
- Lot 8 Graphite Dr
- 2954 W Copper Ridge Loop
- 2946 W Copper Ridge Loop
- 3003 Forbes Blvd
- 3009 Forbes Blvd
- 2953 W Copper Ridge Loop
- 2942 W Copper Ridge Loop
- 2958 W Copper Ridge Loop
- 2949 W Copper Ridge Loop
- 3015 Forbes Blvd
- 2938 W Copper Ridge Loop
- 2957 W Copper Ridge Loop
- 2966 W Copper Ridge Loop
- 3002 Forbes Blvd
- 3008 Forbes Blvd
- 3014 Forbes Blvd
- 2930 W Copper Ridge Loop
- 2970 W Copper Ridge Loop
- 2941 W Copper Ridge Loop
- 3033 Forbes Blvd
- 3020 Forbes Blvd