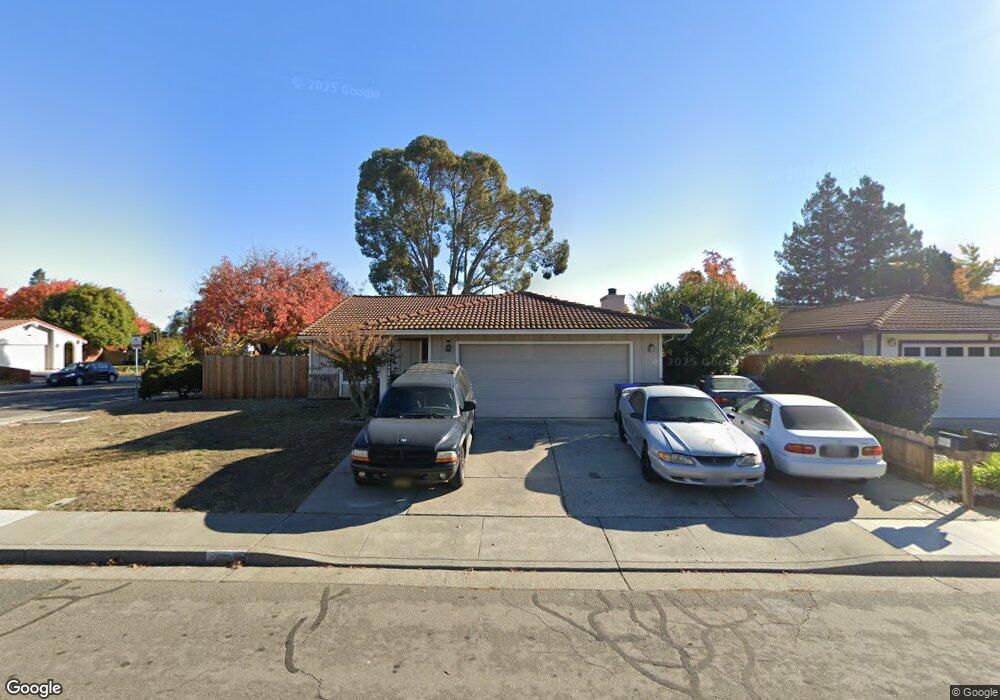
298 Woolner Ct Fairfield, CA 94533
Estimated Value: $483,999 - $608,000
3
Beds
2
Baths
1,178
Sq Ft
$449/Sq Ft
Est. Value
About This Home
This home is located at 298 Woolner Ct, Fairfield, CA 94533 and is currently estimated at $529,000, approximately $449 per square foot. 298 Woolner Ct is a home located in Solano County with nearby schools including Crystal Middle School, Armijo High School, and We R Family Christian School.
Ownership History
Date
Name
Owned For
Owner Type
Purchase Details
Closed on
Jan 27, 2014
Sold by
Harris Laurelle J
Bought by
Harris Laurell J
Current Estimated Value
Purchase Details
Closed on
May 25, 2011
Sold by
Aurora Loan Services Llc
Bought by
Harris Laurelle J
Purchase Details
Closed on
Dec 28, 2010
Sold by
Lemus David J and Lemus Maria I
Bought by
Aurora Loan Services Llc
Purchase Details
Closed on
Feb 11, 2005
Sold by
Nakhiengchanh Sounthone
Bought by
Lemus David J and Lemus Maria I
Home Financials for this Owner
Home Financials are based on the most recent Mortgage that was taken out on this home.
Original Mortgage
$259,000
Interest Rate
6.75%
Mortgage Type
Purchase Money Mortgage
Purchase Details
Closed on
Apr 28, 2004
Sold by
Campanali Michael Nicholas and Nakhiengchanh Southone
Bought by
Nakhiengchanh Sounthone
Create a Home Valuation Report for This Property
The Home Valuation Report is an in-depth analysis detailing your home's value as well as a comparison with similar homes in the area
Home Values in the Area
Average Home Value in this Area
Purchase History
| Date | Buyer | Sale Price | Title Company |
|---|---|---|---|
| Harris Laurell J | -- | Old Republic Title Co | |
| Harris Laurelle J | $130,500 | Fidelity National Title Comp | |
| Aurora Loan Services Llc | $279,529 | Accommodation | |
| Lemus David J | $370,000 | Fidelity Title Co | |
| Nakhiengchanh Sounthone | -- | -- |
Source: Public Records
Mortgage History
| Date | Status | Borrower | Loan Amount |
|---|---|---|---|
| Previous Owner | Lemus David J | $259,000 | |
| Closed | Lemus David J | $74,000 |
Source: Public Records
Tax History
| Year | Tax Paid | Tax Assessment Tax Assessment Total Assessment is a certain percentage of the fair market value that is determined by local assessors to be the total taxable value of land and additions on the property. | Land | Improvement |
|---|---|---|---|---|
| 2025 | $1,884 | $166,799 | $38,431 | $128,368 |
| 2024 | $1,884 | $163,529 | $37,678 | $125,851 |
| 2023 | $1,827 | $160,324 | $36,940 | $123,384 |
| 2022 | $1,805 | $157,181 | $36,216 | $120,965 |
| 2021 | $1,787 | $154,100 | $35,506 | $118,594 |
| 2020 | $1,746 | $152,520 | $35,142 | $117,378 |
| 2019 | $1,703 | $149,530 | $34,453 | $115,077 |
| 2018 | $1,758 | $146,599 | $33,778 | $112,821 |
| 2017 | $1,677 | $143,725 | $33,116 | $110,609 |
| 2016 | $1,658 | $140,908 | $32,467 | $108,441 |
| 2015 | $1,549 | $138,793 | $31,980 | $106,813 |
| 2014 | $1,535 | $136,075 | $31,354 | $104,721 |
Source: Public Records
Map
Nearby Homes
- 108 Creek View Cir
- 109 Creek View Cir
- 324 Hamilton Dr
- 309 Hamilton Dr
- 315 Hamilton Dr
- 266 De Soto Dr
- 423 Gregory Ln Unit 28L
- 423 Gregory Ln Unit 30
- 1837 Vermont St
- 1949 New Jersey St
- 1443 Woolner Ave
- 1654 Minnesota St
- 1417 Hawaii St
- 1625 Minnesota St
- 3471 Springfield Dr
- 225 Pennsylvania Ave Unit E7
- 1042 Hayes St
- 1316 Empire St
- 1308 Empire St
- 1443 Minnesota St
- 286 Woolner Ct
- 2039 Woolner Ave
- 2033 Woolner Ave
- 2045 Woolner Ave
- 299 Woolner Ct
- 293 Woolner Ct
- 2051 Woolner Ave
- 2020 Woolner Ave
- 280 Woolner Ct
- 2057 Woolner Ave
- 2021 Woolner Ave
- 1909 Enterprise Ct
- 2064 Woolner Ave
- 2016 Woolner Ave
- 1912 Enterprise Ct
- 2063 Woolner Ave
- 2017 Woolner Ave
- 2012 Woolner Ave
- 2116 Vine Ct
- 1905 Enterprise Ct
Your Personal Tour Guide
Ask me questions while you tour the home.