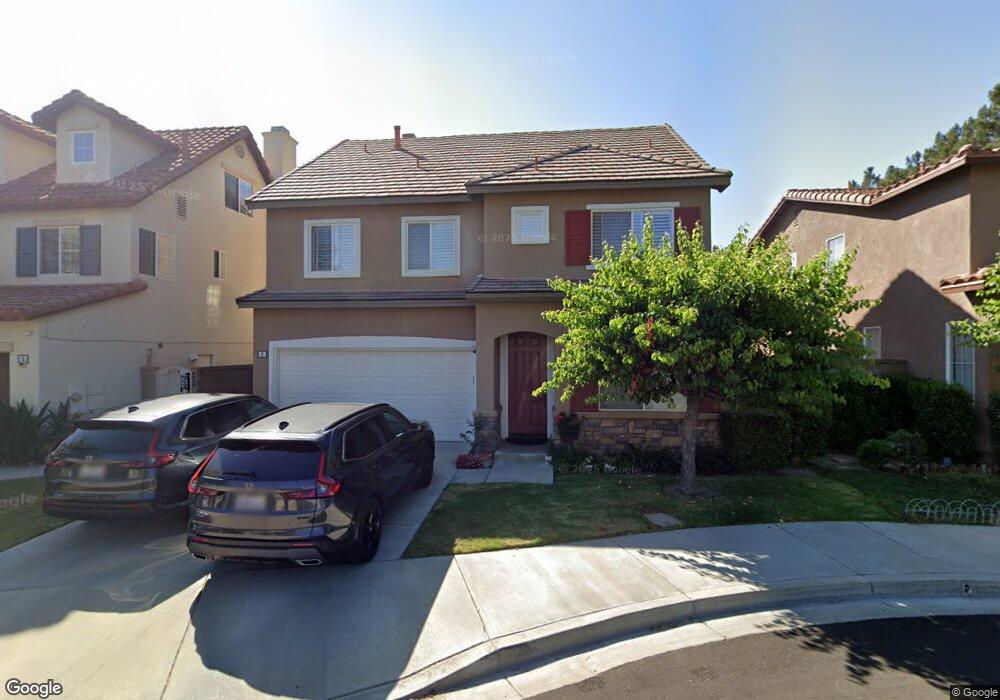
3 Capistrano Irvine, CA 92602
Lower Peters Canyon NeighborhoodEstimated Value: $2,081,367 - $2,272,000
5
Beds
4
Baths
2,600
Sq Ft
$833/Sq Ft
Est. Value
About This Home
This home is located at 3 Capistrano, Irvine, CA 92602 and is currently estimated at $2,165,092, approximately $832 per square foot. 3 Capistrano is a home located in Orange County with nearby schools including Hicks Canyon Elementary School, Orchard Hills School, and Arnold O. Beckman High School.
Ownership History
Date
Name
Owned For
Owner Type
Purchase Details
Closed on
Jul 23, 2020
Sold by
Dosick Andrew S and Dosick Esther J
Bought by
Dosick Andrew Scott and Dosick Esther Judith
Current Estimated Value
Purchase Details
Closed on
May 30, 2008
Sold by
Gateway Bank Fsb
Bought by
Ginsburg Terry and Ginsburg Michelle
Home Financials for this Owner
Home Financials are based on the most recent Mortgage that was taken out on this home.
Original Mortgage
$300,000
Outstanding Balance
$192,410
Interest Rate
6.04%
Mortgage Type
Purchase Money Mortgage
Estimated Equity
$1,972,682
Purchase Details
Closed on
Nov 30, 2006
Sold by
Nam Yeong Hee
Bought by
Gateway Bank Fsb
Purchase Details
Closed on
May 7, 2005
Sold by
Nam Yeong H and Nam Young H
Bought by
Nam Yeong H
Home Financials for this Owner
Home Financials are based on the most recent Mortgage that was taken out on this home.
Original Mortgage
$246,700
Interest Rate
5.65%
Mortgage Type
Credit Line Revolving
Purchase Details
Closed on
Mar 14, 2005
Sold by
Yeon Jung S
Bought by
Nam Yeong Hee
Home Financials for this Owner
Home Financials are based on the most recent Mortgage that was taken out on this home.
Original Mortgage
$246,700
Interest Rate
5.65%
Mortgage Type
Credit Line Revolving
Purchase Details
Closed on
Feb 9, 2005
Sold by
Yeon Jung S
Bought by
Nam Young H
Home Financials for this Owner
Home Financials are based on the most recent Mortgage that was taken out on this home.
Original Mortgage
$742,000
Interest Rate
1%
Mortgage Type
Negative Amortization
Purchase Details
Closed on
Sep 25, 2002
Sold by
California Pacific Homes Inc
Bought by
Yeon Jung S and Nam Yeong H
Home Financials for this Owner
Home Financials are based on the most recent Mortgage that was taken out on this home.
Original Mortgage
$416,100
Interest Rate
5.62%
Create a Home Valuation Report for This Property
The Home Valuation Report is an in-depth analysis detailing your home's value as well as a comparison with similar homes in the area
Home Values in the Area
Average Home Value in this Area
Purchase History
| Date | Buyer | Sale Price | Title Company |
|---|---|---|---|
| Dosick Andrew Scott | -- | None Available | |
| Ginsburg Terry | $850,000 | First American Title Company | |
| Gateway Bank Fsb | $804,872 | First American Title | |
| Nam Yeong H | -- | -- | |
| Nam Yeong Hee | -- | Civic Center Title Services | |
| Nam Young H | -- | -- | |
| Yeon Jung S | $520,500 | Fidelity National Title Co |
Source: Public Records
Mortgage History
| Date | Status | Borrower | Loan Amount |
|---|---|---|---|
| Open | Ginsburg Terry | $300,000 | |
| Previous Owner | Nam Yeong H | $246,700 | |
| Previous Owner | Nam Yeong Hee | $742,000 | |
| Previous Owner | Yeon Jung S | $416,100 | |
| Closed | Yeon Jung S | $52,000 |
Source: Public Records
Tax History
| Year | Tax Paid | Tax Assessment Tax Assessment Total Assessment is a certain percentage of the fair market value that is determined by local assessors to be the total taxable value of land and additions on the property. | Land | Improvement |
|---|---|---|---|---|
| 2025 | $12,360 | $1,116,484 | $742,873 | $373,611 |
| 2024 | $12,360 | $1,094,593 | $728,307 | $366,286 |
| 2023 | $12,129 | $1,073,131 | $714,027 | $359,104 |
| 2022 | $11,900 | $1,052,090 | $700,027 | $352,063 |
| 2021 | $13,035 | $1,031,461 | $686,301 | $345,160 |
| 2020 | $12,920 | $1,020,885 | $679,264 | $341,621 |
| 2019 | $12,659 | $1,000,868 | $665,945 | $334,923 |
| 2018 | $12,421 | $981,244 | $652,888 | $328,356 |
| 2017 | $12,155 | $962,004 | $640,086 | $321,918 |
| 2016 | $11,945 | $943,142 | $627,536 | $315,606 |
| 2015 | $11,788 | $928,976 | $618,110 | $310,866 |
| 2014 | $11,593 | $910,779 | $606,002 | $304,777 |
Source: Public Records
Map
Nearby Homes
Your Personal Tour Guide
Ask me questions while you tour the home.