Estimated Value: $366,000 - $394,000
2
Beds
2
Baths
1,228
Sq Ft
$312/Sq Ft
Est. Value
About This Home
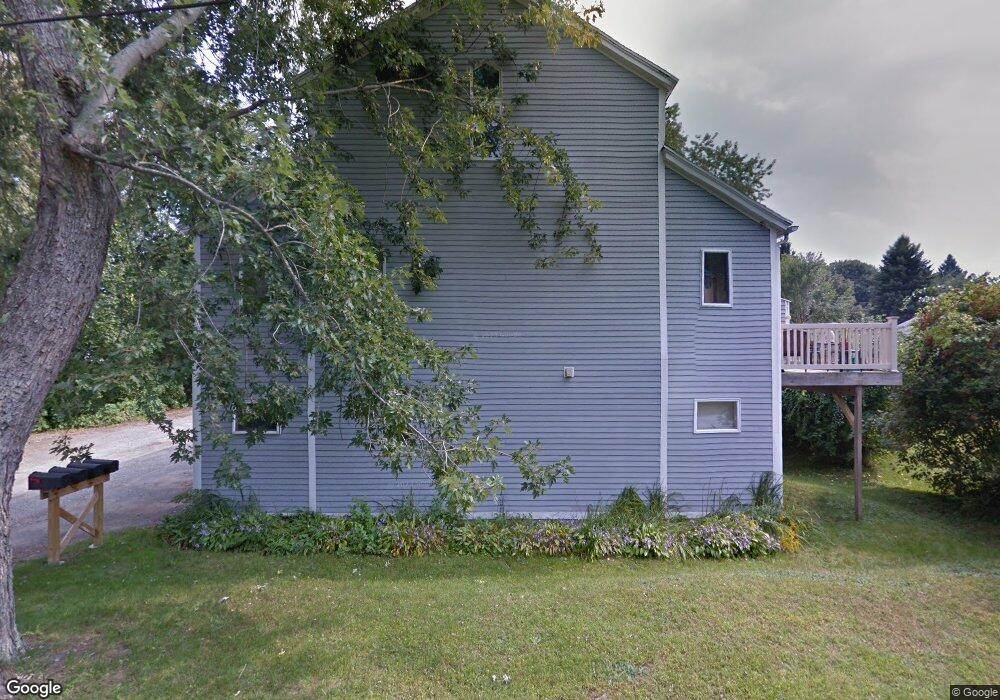
This home is located at 3 Hall St Unit C, Dover, NH 03820 and is currently estimated at $382,827, approximately $311 per square foot. 3 Hall St Unit C is a home located in Strafford County with nearby schools including Horne Street School, Dover Middle School, and Dover Senior High School.
Ownership History
Date
Name
Owned For
Owner Type
Purchase Details
Closed on
Dec 29, 2017
Sold by
Knowles David R
Bought by
Hunt William K
Current Estimated Value
Home Financials for this Owner
Home Financials are based on the most recent Mortgage that was taken out on this home.
Original Mortgage
$151,900
Outstanding Balance
$128,218
Interest Rate
3.95%
Mortgage Type
Purchase Money Mortgage
Estimated Equity
$254,609
Purchase Details
Closed on
Jul 1, 2014
Sold by
Scanlon Kathleen A
Bought by
Knowles David R
Purchase Details
Closed on
May 6, 1998
Sold by
Hendrickx Donna M
Bought by
Scanlon Maurice D and Scanlon Kathleen A
Home Financials for this Owner
Home Financials are based on the most recent Mortgage that was taken out on this home.
Original Mortgage
$63,100
Interest Rate
7.05%
Create a Home Valuation Report for This Property
The Home Valuation Report is an in-depth analysis detailing your home's value as well as a comparison with similar homes in the area
Home Values in the Area
Average Home Value in this Area
Purchase History
| Date | Buyer | Sale Price | Title Company |
|---|---|---|---|
| Hunt William K | $189,933 | -- | |
| Hunt William K | $189,933 | -- | |
| Knowles David R | $145,000 | -- | |
| Knowles David R | $145,000 | -- | |
| Scanlon Maurice D | $78,900 | -- | |
| Scanlon Maurice D | $78,900 | -- |
Source: Public Records
Mortgage History
| Date | Status | Borrower | Loan Amount |
|---|---|---|---|
| Open | Hunt William K | $151,900 | |
| Closed | Hunt William K | $151,900 | |
| Previous Owner | Scanlon Maurice D | $63,100 | |
| Closed | Scanlon Maurice D | $0 |
Source: Public Records
Tax History
| Year | Tax Paid | Tax Assessment Tax Assessment Total Assessment is a certain percentage of the fair market value that is determined by local assessors to be the total taxable value of land and additions on the property. | Land | Improvement |
|---|---|---|---|---|
| 2024 | $6,134 | $337,600 | $97,000 | $240,600 |
| 2023 | $5,556 | $297,100 | $86,000 | $211,100 |
| 2022 | $5,273 | $265,800 | $75,000 | $190,800 |
| 2021 | $4,961 | $228,600 | $61,000 | $167,600 |
| 2020 | $4,848 | $195,100 | $56,000 | $139,100 |
| 2019 | $4,640 | $184,200 | $48,000 | $136,200 |
| 2018 | $4,396 | $176,400 | $40,000 | $136,400 |
| 2017 | $3,578 | $138,300 | $13,000 | $125,300 |
| 2016 | $3,349 | $127,400 | $9,000 | $118,400 |
| 2015 | $3,473 | $130,500 | $15,000 | $115,500 |
| 2014 | $3,394 | $130,500 | $15,000 | $115,500 |
| 2011 | $3,879 | $154,400 | $33,000 | $121,400 |
Source: Public Records
Map
Nearby Homes
- Lot 0 Page Ave
- 9 Lowell Ave
- 725 Central Ave Unit 203
- 725 Central Ave Unit LL03
- 725 Central Ave Unit 301
- 725 Central Ave Unit 302
- 725 Central Ave Unit LL01
- 725 Central Ave Unit 304
- 34 Floral Ave Unit 5
- 0 Indian Brook Rd Unit C
- 63 Sixth St
- 20 Baker St
- 472 High St
- 80 Glenwood Ave
- 47 Central Ave
- 0 4th St Unit 2
- 249 Clement Rd
- 23 Townsend Dr
- Lot 6 Emerson Ridge Unit 6
- Lot 1 Emerson Ridge Unit 1
- 3 Hall St
- 3 Hall St Unit D
- 3 Hall St Unit B
- 3 Hall St Unit A
- 3 Hall St Unit 3B
- 3 Hall St Unit 3C
- 3D Hall St Unit D
- 4 Gilman St Unit B
- 4 Gilman St Unit A
- 4 Gilman St Unit 1
- 4 Gilman St Unit 4
- 4 Gilman St Unit 4A
- 4 Gilman St Unit 4B
- 6 Gilman St Unit B
- 6 Gilman St Unit A
- 6 Gilman St Unit 6A
- 6 Gilman St
- 5 Hall St
- 1 Hall St
- TBD Hall St
Your Personal Tour Guide
Ask me questions while you tour the home.