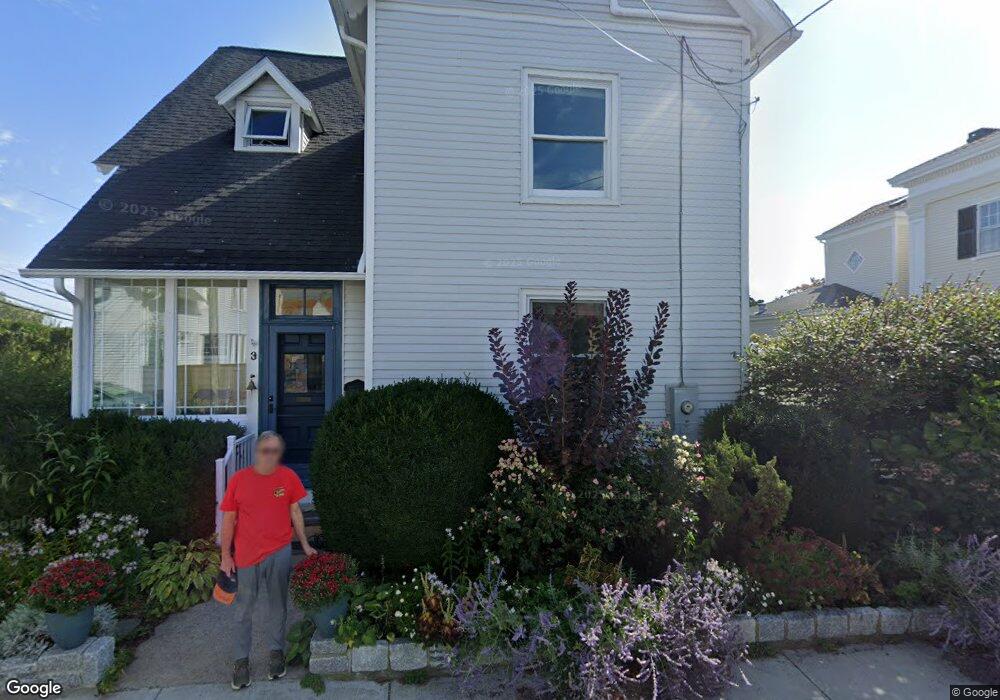
3 Main St Stonington, CT 06378
Estimated Value: $834,000 - $1,283,000
3
Beds
3
Baths
1,977
Sq Ft
$516/Sq Ft
Est. Value
About This Home
This home is located at 3 Main St, Stonington, CT 06378 and is currently estimated at $1,019,613, approximately $515 per square foot. 3 Main St is a home located in New London County with nearby schools including Stonington Middle School, Stonington High School, and Pine Point School.
Ownership History
Date
Name
Owned For
Owner Type
Purchase Details
Closed on
Apr 24, 2018
Sold by
Despard Alice H
Bought by
Chandler Stuart C and Despard Alice H
Current Estimated Value
Purchase Details
Closed on
Dec 30, 2014
Sold by
H Despard Lifetime T A
Bought by
Despard Alice H
Purchase Details
Closed on
Feb 14, 2014
Sold by
Clement L Despard Ret and Holland
Bought by
Alice H Despard Lifetm H and Alice Holland
Purchase Details
Closed on
Feb 25, 2013
Sold by
Despard Clement L
Bought by
Clement L Despard Ret
Purchase Details
Closed on
Dec 28, 1981
Bought by
Despard Lucy E and Despard Alice H
Create a Home Valuation Report for This Property
The Home Valuation Report is an in-depth analysis detailing your home's value as well as a comparison with similar homes in the area
Home Values in the Area
Average Home Value in this Area
Purchase History
| Date | Buyer | Sale Price | Title Company |
|---|---|---|---|
| Chandler Stuart C | -- | -- | |
| Chandler Stuart C | -- | -- | |
| Despard Alice H | -- | -- | |
| Despard Alice H | -- | -- | |
| Alice H Despard Lifetm H | -- | -- | |
| Lifetm Alice H Despard | -- | -- | |
| Clement L Despard Ret | -- | -- | |
| Clement L Despard Ret | -- | -- | |
| Despard Lucy E | -- | -- |
Source: Public Records
Tax History Compared to Growth
Tax History
| Year | Tax Paid | Tax Assessment Tax Assessment Total Assessment is a certain percentage of the fair market value that is determined by local assessors to be the total taxable value of land and additions on the property. | Land | Improvement |
|---|---|---|---|---|
| 2025 | $5,232 | $468,500 | $264,600 | $203,900 |
| 2024 | $9,136 | $468,500 | $264,600 | $203,900 |
| 2023 | $9,206 | $468,500 | $264,600 | $203,900 |
| 2022 | $8,425 | $316,000 | $185,200 | $130,800 |
| 2021 | $8,485 | $316,000 | $185,200 | $130,800 |
| 2020 | $8,330 | $316,000 | $185,200 | $130,800 |
| 2019 | $8,330 | $316,000 | $185,200 | $130,800 |
| 2018 | $8,083 | $316,000 | $185,200 | $130,800 |
| 2017 | $7,922 | $306,700 | $198,500 | $108,200 |
| 2016 | $7,701 | $306,700 | $198,500 | $108,200 |
| 2015 | $7,307 | $304,200 | $198,500 | $105,700 |
| 2014 | $6,659 | $290,400 | $198,500 | $91,900 |
Source: Public Records
Map
Nearby Homes