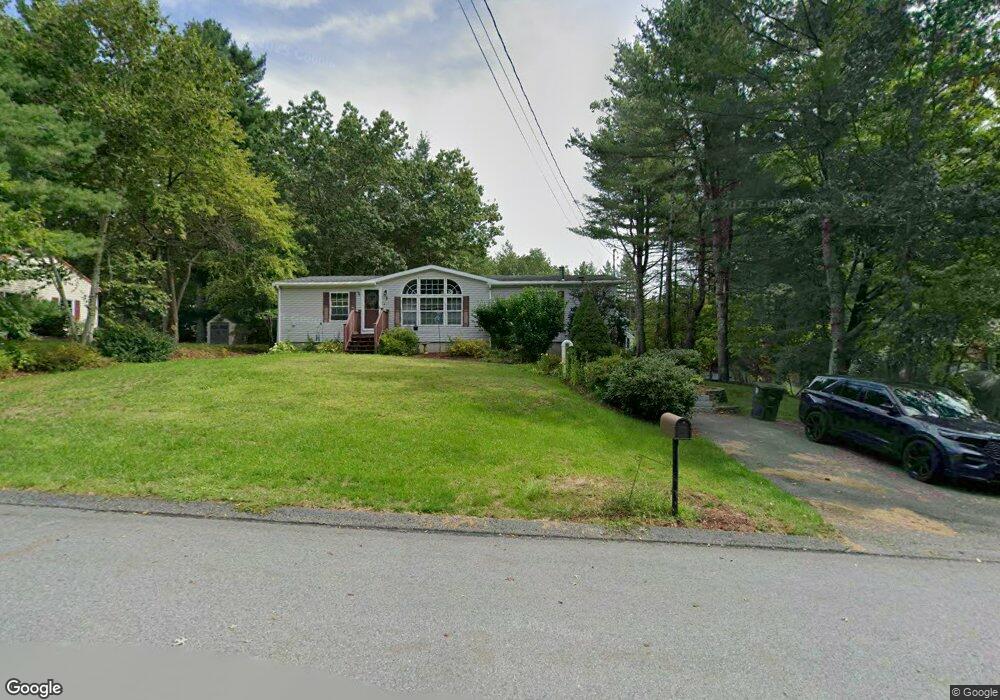
3 Tammy Cir Nashua, NH 03062
West Hollis NeighborhoodEstimated Value: $497,000 - $544,000
3
Beds
2
Baths
1,352
Sq Ft
$382/Sq Ft
Est. Value
About This Home
This home is located at 3 Tammy Cir, Nashua, NH 03062 and is currently estimated at $516,966, approximately $382 per square foot. 3 Tammy Cir is a home located in Hillsborough County with nearby schools including Main Dunstable School, Elm Street Middle School, and Nashua High School South.
Ownership History
Date
Name
Owned For
Owner Type
Purchase Details
Closed on
Oct 14, 2020
Sold by
Tate Amanda M
Bought by
Tate Amanda M and Shelley Gregory
Current Estimated Value
Home Financials for this Owner
Home Financials are based on the most recent Mortgage that was taken out on this home.
Original Mortgage
$172,000
Outstanding Balance
$152,004
Interest Rate
2.8%
Mortgage Type
New Conventional
Estimated Equity
$364,962
Purchase Details
Closed on
Aug 4, 2016
Sold by
Jason Joyce A
Bought by
Tate Amanda M
Purchase Details
Closed on
Jul 28, 1998
Sold by
Michaud Alan R and Michaud Pauline C
Bought by
Jason Joyce A
Create a Home Valuation Report for This Property
The Home Valuation Report is an in-depth analysis detailing your home's value as well as a comparison with similar homes in the area
Home Values in the Area
Average Home Value in this Area
Purchase History
| Date | Buyer | Sale Price | Title Company |
|---|---|---|---|
| Tate Amanda M | -- | None Available | |
| Tate Amanda M | $200,000 | -- | |
| Jason Joyce A | $39,900 | -- |
Source: Public Records
Mortgage History
| Date | Status | Borrower | Loan Amount |
|---|---|---|---|
| Open | Tate Amanda M | $172,000 | |
| Previous Owner | Jason Joyce A | $19,135 | |
| Previous Owner | Jason Joyce A | $85,000 |
Source: Public Records
Tax History Compared to Growth
Tax History
| Year | Tax Paid | Tax Assessment Tax Assessment Total Assessment is a certain percentage of the fair market value that is determined by local assessors to be the total taxable value of land and additions on the property. | Land | Improvement |
|---|---|---|---|---|
| 2024 | $7,570 | $476,100 | $162,400 | $313,700 |
| 2023 | $7,319 | $401,500 | $129,900 | $271,600 |
| 2022 | $7,255 | $401,500 | $129,900 | $271,600 |
| 2021 | $6,434 | $277,100 | $86,600 | $190,500 |
| 2020 | $6,256 | $276,700 | $86,600 | $190,100 |
| 2019 | $6,021 | $276,700 | $86,600 | $190,100 |
| 2018 | $5,869 | $276,700 | $86,600 | $190,100 |
| 2017 | $5,292 | $205,200 | $71,400 | $133,800 |
| 2016 | $5,144 | $205,200 | $71,400 | $133,800 |
| 2015 | $5,034 | $205,200 | $71,400 | $133,800 |
| 2014 | $4,935 | $205,200 | $71,400 | $133,800 |
Source: Public Records
Map
Nearby Homes