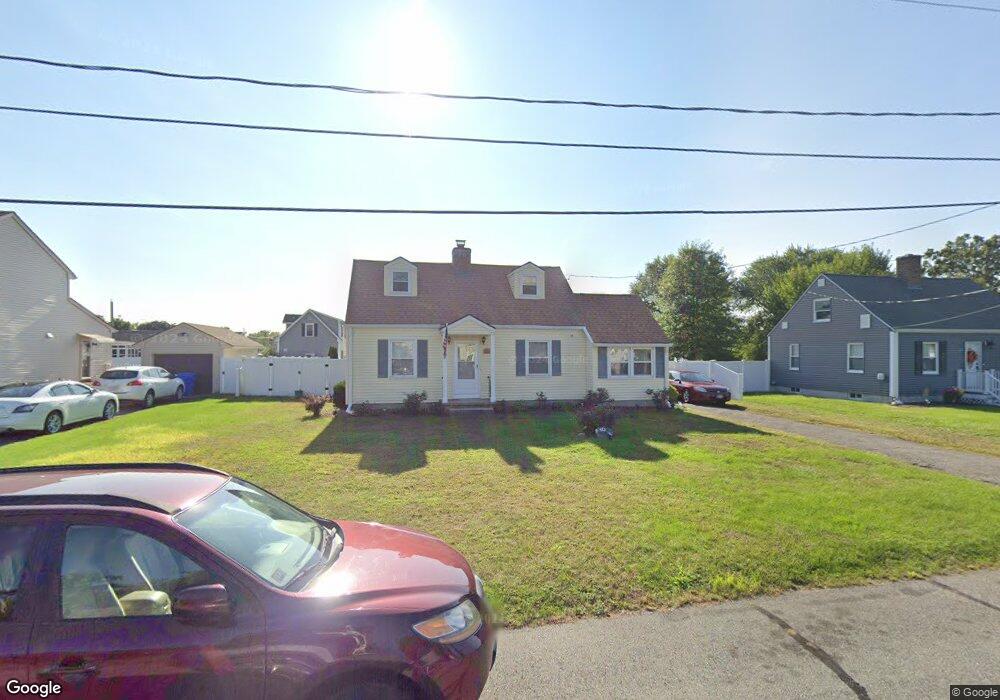
30 Amanda St Springfield, MA 01118
East Forest Park NeighborhoodEstimated Value: $303,000 - $319,000
3
Beds
1
Bath
1,217
Sq Ft
$253/Sq Ft
Est. Value
About This Home
This home is located at 30 Amanda St, Springfield, MA 01118 and is currently estimated at $307,999, approximately $253 per square foot. 30 Amanda St is a home located in Hampden County with nearby schools including Mary A. Dryden Veterans Memorial School, M Marcus Kiley Middle, and Springfield High School of Science and Technology.
Ownership History
Date
Name
Owned For
Owner Type
Purchase Details
Closed on
May 15, 2014
Sold by
Culp Delores
Bought by
Culp Delores and Culp Justin L
Current Estimated Value
Purchase Details
Closed on
Aug 20, 1999
Sold by
Fuss Brian H and Fuss Denise L
Bought by
Culp Delores
Home Financials for this Owner
Home Financials are based on the most recent Mortgage that was taken out on this home.
Original Mortgage
$83,129
Interest Rate
7.6%
Mortgage Type
Purchase Money Mortgage
Purchase Details
Closed on
Nov 9, 1992
Sold by
Bottum James W
Bought by
Fleet Mtg Corp
Home Financials for this Owner
Home Financials are based on the most recent Mortgage that was taken out on this home.
Original Mortgage
$67,800
Interest Rate
7.9%
Create a Home Valuation Report for This Property
The Home Valuation Report is an in-depth analysis detailing your home's value as well as a comparison with similar homes in the area
Home Values in the Area
Average Home Value in this Area
Purchase History
| Date | Buyer | Sale Price | Title Company |
|---|---|---|---|
| Culp Delores | -- | -- | |
| Culp Delores | $86,000 | -- | |
| Fleet Mtg Corp | $121,200 | -- |
Source: Public Records
Mortgage History
| Date | Status | Borrower | Loan Amount |
|---|---|---|---|
| Previous Owner | Fleet Mtg Corp | $83,129 | |
| Previous Owner | Fleet Mtg Corp | $67,800 | |
| Previous Owner | Fleet Mtg Corp | $20,000 | |
| Closed | Fleet Mtg Corp | $2,470 |
Source: Public Records
Tax History
| Year | Tax Paid | Tax Assessment Tax Assessment Total Assessment is a certain percentage of the fair market value that is determined by local assessors to be the total taxable value of land and additions on the property. | Land | Improvement |
|---|---|---|---|---|
| 2025 | $4,063 | $259,100 | $49,000 | $210,100 |
| 2024 | $3,548 | $220,900 | $49,000 | $171,900 |
| 2023 | $3,546 | $208,000 | $46,600 | $161,400 |
| 2022 | $3,290 | $174,800 | $46,600 | $128,200 |
| 2021 | $3,353 | $177,400 | $42,400 | $135,000 |
| 2020 | $4,815 | $158,300 | $42,400 | $115,900 |
| 2019 | $2,911 | $147,900 | $42,400 | $105,500 |
| 2018 | $2,741 | $141,900 | $42,400 | $99,500 |
| 2017 | $2,741 | $139,400 | $42,400 | $97,000 |
| 2016 | $2,507 | $127,500 | $42,400 | $85,100 |
| 2015 | $2,414 | $122,700 | $42,400 | $80,300 |
Source: Public Records
Map
Nearby Homes
- 22 Amanda St
- 44 Amanda St
- 118 Pilgrim Rd
- 0 NS (24) Alden St
- 55 Mandalay Rd
- 236 Pondview Dr
- 867 Roosevelt Ave
- 410 Allen St
- 135-137 Suffolk St
- 124-126 Westford Cir
- 11 Ina St
- 134 Eddywood St
- 87 Fenwick St
- 7 Ashbrook St
- 111 Marlborough St
- 21 Westford Cir
- 89 Bristol St
- 189 Northampton Ave
- 41 Olive St
- 54 S Shore Dr
Your Personal Tour Guide
Ask me questions while you tour the home.