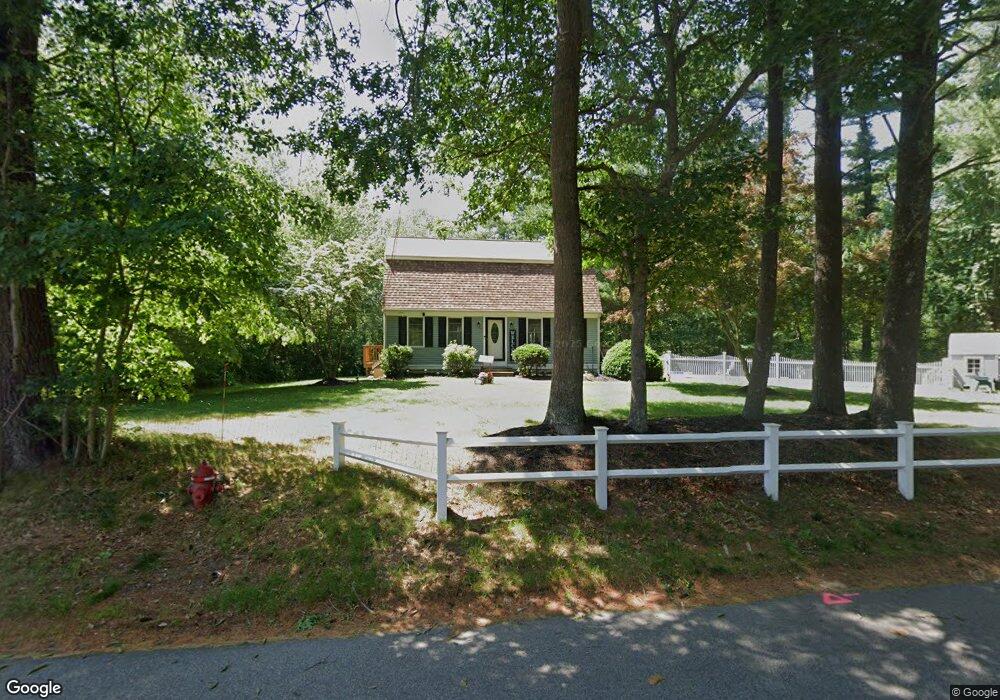
30 Short St Bridgewater, MA 02324
Estimated Value: $562,000 - $588,290
3
Beds
2
Baths
1,550
Sq Ft
$371/Sq Ft
Est. Value
About This Home
This home is located at 30 Short St, Bridgewater, MA 02324 and is currently estimated at $575,323, approximately $371 per square foot. 30 Short St is a home located in Plymouth County with nearby schools including Mitchell Elementary School, Williams Intermediate School, and Bridgewater Middle School.
Ownership History
Date
Name
Owned For
Owner Type
Purchase Details
Closed on
Dec 6, 2006
Sold by
Williams Samuel F and Williams Kathleen M
Bought by
Williams Kathleen M
Current Estimated Value
Home Financials for this Owner
Home Financials are based on the most recent Mortgage that was taken out on this home.
Original Mortgage
$313,000
Outstanding Balance
$188,068
Interest Rate
6.4%
Mortgage Type
Purchase Money Mortgage
Estimated Equity
$387,255
Purchase Details
Closed on
Jun 1, 2001
Sold by
Brogan James J and Brogan Jennifer M
Bought by
Williams Samuel F and Williams Kathleen M
Create a Home Valuation Report for This Property
The Home Valuation Report is an in-depth analysis detailing your home's value as well as a comparison with similar homes in the area
Home Values in the Area
Average Home Value in this Area
Purchase History
| Date | Buyer | Sale Price | Title Company |
|---|---|---|---|
| Williams Kathleen M | $17,000 | -- | |
| Williams Samuel F | $239,900 | -- |
Source: Public Records
Mortgage History
| Date | Status | Borrower | Loan Amount |
|---|---|---|---|
| Open | Williams Samuel F | $313,000 | |
| Previous Owner | Williams Samuel F | $50,500 | |
| Previous Owner | Williams Samuel F | $48,400 |
Source: Public Records
Tax History Compared to Growth
Tax History
| Year | Tax Paid | Tax Assessment Tax Assessment Total Assessment is a certain percentage of the fair market value that is determined by local assessors to be the total taxable value of land and additions on the property. | Land | Improvement |
|---|---|---|---|---|
| 2025 | $5,752 | $486,200 | $197,100 | $289,100 |
| 2024 | $5,592 | $460,600 | $187,700 | $272,900 |
| 2023 | $5,670 | $441,600 | $175,400 | $266,200 |
| 2022 | $5,555 | $387,900 | $153,900 | $234,000 |
| 2021 | $7,095 | $346,400 | $137,400 | $209,000 |
| 2020 | $4,946 | $335,800 | $132,100 | $203,700 |
| 2019 | $14,275 | $326,400 | $132,100 | $194,300 |
| 2018 | $40 | $297,800 | $121,900 | $175,900 |
| 2017 | $6,292 | $281,200 | $121,900 | $159,300 |
| 2016 | $4,174 | $268,600 | $119,500 | $149,100 |
| 2015 | $4,201 | $258,700 | $116,000 | $142,700 |
| 2014 | $4,015 | $247,100 | $106,700 | $140,400 |
Source: Public Records
Map
Nearby Homes
- 904 Auburn St
- 230 Cherry St
- 199 Cherry St
- 0 Auburn St
- 163 Cherry St
- 74 Magnolia Way
- 81 Pratt Ave Unit Lot 101
- 64 Pratt Ave
- 73 Pratt Ave Unit LOT 126
- 73 Pratt Ave
- 40 Old Summit St
- 12 Forbes Rd Unit Lot 84
- 26 Old Summit St
- The Beacon Plan at Duxburrow Estates
- The Nottingham Plan at Duxburrow Estates
- The Lexington Plan at Duxburrow Estates
- The Allcot Plan at Duxburrow Estates
- The Camden Plan at Duxburrow Estates
- The Tacoma Plan at Duxburrow Estates
- The Fenway Plan at Duxburrow Estates