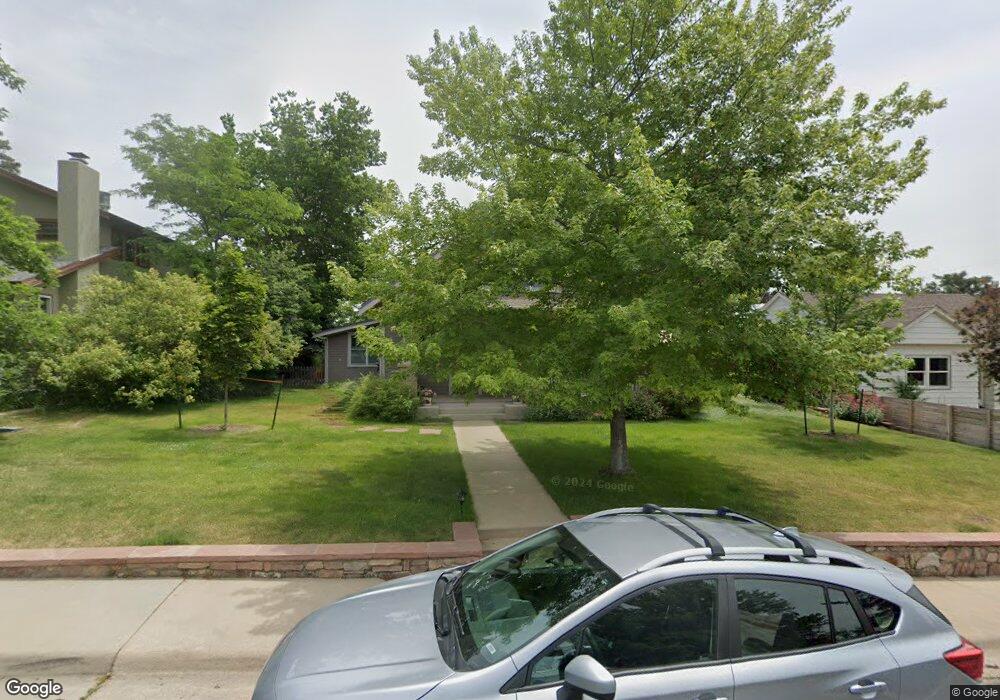
3016 6th St Boulder, CO 80304
Newlands NeighborhoodEstimated Value: $2,333,367 - $2,874,000
3
Beds
3
Baths
2,440
Sq Ft
$1,060/Sq Ft
Est. Value
About This Home
This home is located at 3016 6th St, Boulder, CO 80304 and is currently estimated at $2,585,342, approximately $1,059 per square foot. 3016 6th St is a home located in Boulder County with nearby schools including Foothill Elementary School, Casey Middle School, and Boulder High School.
Ownership History
Date
Name
Owned For
Owner Type
Purchase Details
Closed on
Jan 20, 2005
Sold by
Hufford George A and Hufford Lottie W
Bought by
Hughes Robert P
Current Estimated Value
Home Financials for this Owner
Home Financials are based on the most recent Mortgage that was taken out on this home.
Original Mortgage
$450,000
Outstanding Balance
$200,531
Interest Rate
4%
Mortgage Type
Seller Take Back
Estimated Equity
$2,384,811
Purchase Details
Closed on
Jul 10, 1973
Bought by
Hughes Janet R and Hughes Robert P
Create a Home Valuation Report for This Property
The Home Valuation Report is an in-depth analysis detailing your home's value as well as a comparison with similar homes in the area
Home Values in the Area
Average Home Value in this Area
Purchase History
| Date | Buyer | Sale Price | Title Company |
|---|---|---|---|
| Hughes Robert P | $450,000 | -- | |
| Hughes Janet R | $26,500 | -- |
Source: Public Records
Mortgage History
| Date | Status | Borrower | Loan Amount |
|---|---|---|---|
| Open | Hughes Robert P | $450,000 |
Source: Public Records
Tax History
| Year | Tax Paid | Tax Assessment Tax Assessment Total Assessment is a certain percentage of the fair market value that is determined by local assessors to be the total taxable value of land and additions on the property. | Land | Improvement |
|---|---|---|---|---|
| 2025 | $15,120 | $159,125 | $105,331 | $53,794 |
| 2024 | $15,120 | $159,125 | $105,331 | $53,794 |
| 2023 | $14,858 | $178,749 | $116,734 | $65,700 |
| 2022 | $12,026 | $136,449 | $83,831 | $52,618 |
| 2021 | $11,467 | $140,376 | $86,243 | $54,133 |
| 2020 | $9,802 | $119,763 | $76,362 | $43,401 |
| 2019 | $9,652 | $119,763 | $76,362 | $43,401 |
| 2018 | $8,440 | $104,551 | $61,272 | $43,279 |
| 2017 | $8,176 | $115,588 | $67,740 | $47,848 |
| 2016 | $7,826 | $98,362 | $50,944 | $47,418 |
| 2015 | $8,063 | $82,242 | $35,740 | $46,502 |
| 2014 | $6,915 | $82,242 | $35,740 | $46,502 |
Source: Public Records
Map
Nearby Homes
- 2958 6th St
- 501 Evergreen Ave
- 3056 8th St
- 3033 3rd St
- 3189 5th St
- 3015 3rd St
- 515 Alpine Ave
- 300 Forest Ave
- 815 Alpine Ave Unit 2
- 3135 11th St
- 3086 11th St
- 865 Grape Ave Unit X
- 1023 Forest Ave
- 2675 Dakota Place Unit Newlands
- 521 Hawthorn Ave
- 711 Hawthorn Ave
- 503 Hawthorn Ave
- 1237 Elder Ave Unit 1
- 653 Dewey Ave
- 640 Iris Ave
Your Personal Tour Guide
Ask me questions while you tour the home.