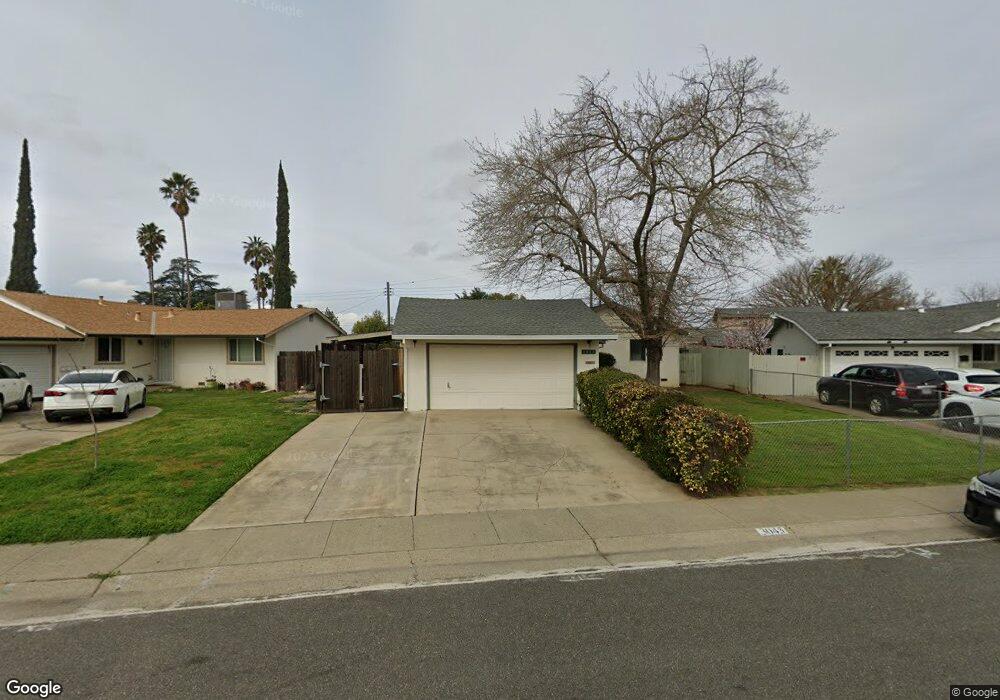
3045 Ramsgate Way Rancho Cordova, CA 95670
White Rock NeighborhoodEstimated Value: $389,000 - $411,047
3
Beds
2
Baths
1,098
Sq Ft
$366/Sq Ft
Est. Value
About This Home
This home is located at 3045 Ramsgate Way, Rancho Cordova, CA 95670 and is currently estimated at $402,349, approximately $366 per square foot. 3045 Ramsgate Way is a home located in Sacramento County with nearby schools including White Rock Elementary School, Mills Middle School, and Cordova High School.
Ownership History
Date
Name
Owned For
Owner Type
Purchase Details
Closed on
Mar 11, 2003
Sold by
Senna Arlene E and Johnson Paula G
Bought by
Senna Arlene E
Current Estimated Value
Home Financials for this Owner
Home Financials are based on the most recent Mortgage that was taken out on this home.
Original Mortgage
$136,000
Interest Rate
5.83%
Mortgage Type
Balloon
Purchase Details
Closed on
Dec 14, 2000
Sold by
Senna Daniel
Bought by
Johnson Paula
Home Financials for this Owner
Home Financials are based on the most recent Mortgage that was taken out on this home.
Original Mortgage
$116,102
Interest Rate
7.81%
Mortgage Type
FHA
Purchase Details
Closed on
Nov 16, 2000
Sold by
Tesar Jonathan E and Tesar Ruth D
Bought by
Senna Arlene E and Johnson Paula G
Home Financials for this Owner
Home Financials are based on the most recent Mortgage that was taken out on this home.
Original Mortgage
$116,102
Interest Rate
7.81%
Mortgage Type
FHA
Create a Home Valuation Report for This Property
The Home Valuation Report is an in-depth analysis detailing your home's value as well as a comparison with similar homes in the area
Home Values in the Area
Average Home Value in this Area
Purchase History
| Date | Buyer | Sale Price | Title Company |
|---|---|---|---|
| Senna Arlene E | -- | North American Title Company | |
| Johnson Paula | -- | Fidelity National Title Co | |
| Senna Arlene E | $87,000 | Fidelity National Title Co |
Source: Public Records
Mortgage History
| Date | Status | Borrower | Loan Amount |
|---|---|---|---|
| Closed | Senna Arlene E | $136,000 | |
| Closed | Senna Arlene E | $116,102 |
Source: Public Records
Tax History Compared to Growth
Tax History
| Year | Tax Paid | Tax Assessment Tax Assessment Total Assessment is a certain percentage of the fair market value that is determined by local assessors to be the total taxable value of land and additions on the property. | Land | Improvement |
|---|---|---|---|---|
| 2025 | $1,960 | $167,952 | $55,323 | $112,629 |
| 2024 | $1,960 | $164,660 | $54,239 | $110,421 |
| 2023 | $1,919 | $161,432 | $53,176 | $108,256 |
| 2022 | $1,893 | $158,268 | $52,134 | $106,134 |
| 2021 | $1,854 | $155,165 | $51,112 | $104,053 |
| 2020 | $1,841 | $153,575 | $50,588 | $102,987 |
| 2019 | $1,810 | $150,565 | $49,597 | $100,968 |
| 2018 | $1,762 | $147,614 | $48,625 | $98,989 |
| 2017 | $1,716 | $144,721 | $47,672 | $97,049 |
| 2016 | $1,668 | $141,885 | $46,738 | $95,147 |
| 2015 | $1,512 | $133,522 | $43,984 | $89,538 |
| 2014 | $1,545 | $125,964 | $41,494 | $84,470 |
Source: Public Records
Map
Nearby Homes
- 3231 Nosler Ct
- 10035 Mills Station Rd
- 10035 Mills Station Rd Unit 136
- 10035 Mills Station Rd Unit 153
- 10233 Countryside Way
- 47 Temple
- 10167 Country Way
- 10472 Abbottford Way
- 10433 Rockingham Dr
- 2701 El Caprice Dr
- 10204 Malaga Way
- 60 Count Way
- 2629 La Loma Dr
- 146 Lord Way
- 10276 S White Rock Rd
- 10470 Spaulding Way
- 2904 Poole Dr
- 2926 Poole Dr Unit 25
- 3116 Tory Ln
- 3102 Redcoat Ln Unit 139
- 3053 Ramsgate Way
- 3041 Ramsgate Way
- 3033 Stoke Ct
- 3036 Margate Way
- 3037 Ramsgate Way
- 3054 Ramsgate Way
- 3031 Stoke Ct
- 3035 Stoke Ct
- 3044 Abbott Ct
- 3056 Ramsgate Way
- 3041 Margate Way
- 3037 Margate Way
- 3028 Margate Way
- 3058 Ramsgate Way
- 3052 Abbott Ct
- 3042 Ramsgate Way
- 3029 Stoke Ct
- 3046 Abbott Ct
- 3040 Ramsgate Way
- 3033 Margate Way