Estimated Value: $451,865 - $522,000
4
Beds
3
Baths
2,888
Sq Ft
$169/Sq Ft
Est. Value
About This Home
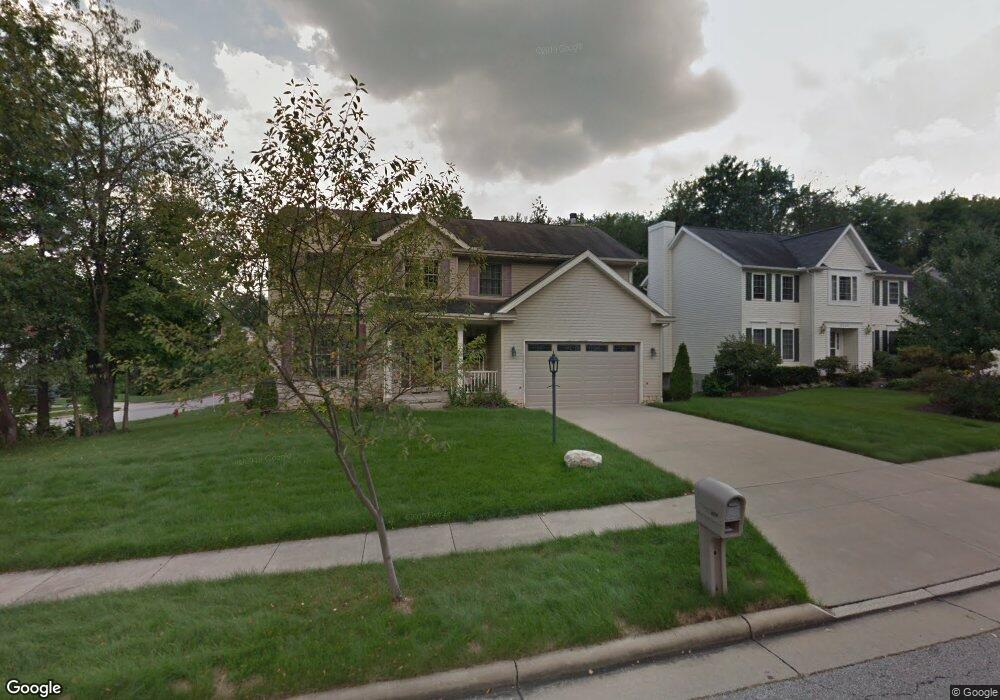
This home is located at 3054 Highpoint Trail, Stow, OH 44224 and is currently estimated at $487,466, approximately $168 per square foot. 3054 Highpoint Trail is a home located in Summit County with nearby schools including Stow-Munroe Falls High School, Holy Family Elementary School, and St Patrick Elementary School.
Ownership History
Date
Name
Owned For
Owner Type
Purchase Details
Closed on
Aug 29, 2001
Sold by
Rockport Homes Inc
Bought by
Thompson Paul A and Thompson Karen A M
Current Estimated Value
Home Financials for this Owner
Home Financials are based on the most recent Mortgage that was taken out on this home.
Original Mortgage
$243,200
Outstanding Balance
$95,111
Interest Rate
7.03%
Estimated Equity
$392,355
Purchase Details
Closed on
May 18, 2000
Sold by
Boggs Thomas G
Bought by
Rockport Homes Inc
Home Financials for this Owner
Home Financials are based on the most recent Mortgage that was taken out on this home.
Original Mortgage
$216,000
Interest Rate
8.13%
Purchase Details
Closed on
Dec 16, 1999
Sold by
C O Hewitt Boggs Co Inc
Bought by
Boggs Thomas G
Create a Home Valuation Report for This Property
The Home Valuation Report is an in-depth analysis detailing your home's value as well as a comparison with similar homes in the area
Home Values in the Area
Average Home Value in this Area
Purchase History
| Date | Buyer | Sale Price | Title Company |
|---|---|---|---|
| Thompson Paul A | $256,000 | Buckeye Reserve Title Agency | |
| Rockport Homes Inc | $44,900 | Midland Commerce Group | |
| Boggs Thomas G | $39,865 | Midland Commerce Group |
Source: Public Records
Mortgage History
| Date | Status | Borrower | Loan Amount |
|---|---|---|---|
| Open | Thompson Paul A | $243,200 | |
| Closed | Rockport Homes Inc | $216,000 |
Source: Public Records
Tax History
| Year | Tax Paid | Tax Assessment Tax Assessment Total Assessment is a certain percentage of the fair market value that is determined by local assessors to be the total taxable value of land and additions on the property. | Land | Improvement |
|---|---|---|---|---|
| 2024 | $7,849 | $139,846 | $25,277 | $114,569 |
| 2023 | $7,849 | $139,846 | $25,277 | $114,569 |
| 2022 | $6,318 | $99,288 | $17,927 | $81,361 |
| 2021 | $5,654 | $99,288 | $17,927 | $81,361 |
| 2020 | $5,556 | $99,290 | $17,930 | $81,360 |
| 2019 | $6,158 | $103,000 | $17,930 | $85,070 |
| 2018 | $6,057 | $103,000 | $17,930 | $85,070 |
| 2017 | $5,225 | $103,000 | $17,930 | $85,070 |
| 2016 | $5,379 | $86,240 | $17,930 | $68,310 |
| 2015 | $5,225 | $86,240 | $17,930 | $68,310 |
| 2014 | $5,230 | $86,240 | $17,930 | $68,310 |
| 2013 | $5,471 | $90,840 | $17,930 | $72,910 |
Source: Public Records
Map
Nearby Homes
- 1245 Chelton Dr
- 350 Silver Meadows Blvd
- 2721 Santa Anita Dr
- 1189 Garth Dr
- 511 Suzanne Dr
- 3313 Crown Pointe Dr
- 0 Middlebury Rd
- 726 Hughey Dr
- 3767 Lake Run Blvd
- 876 Middlebury Rd
- 884 Highridge Ln
- 3874 Lake Run Blvd
- 895 Highridge Ln
- 3905 Kent Rd
- 3958 Lake Run Blvd
- 957 Edgewater Cir Unit 20
- 0 Vira Rd
- 245 Bermont Ave
- 3828 Osage St Unit 3832
- 994 Erin Dr
- 3040 Highpoint Trail
- 3032 Highpoint Trail
- 3051 Highpoint Trail
- 3135 Deercrest Path
- 3055 Ridgeline Trail
- 3143 Deercrest Path
- 3043 Highpoint Trail
- 3115 Deercrest Path
- 3024 Highpoint Trail
- 3035 Highpoint Trail
- 3045 Ridgeline Trail
- 3103 Deercrest Path
- 3161 Deercrest Path
- 3076 Deercrest Path
- 3027 Highpoint Trail
- 2987 Highpoint Trail
- 3037 Ridgeline Trail
- 3091 Deercrest Path
- 3068 Deercrest Path
- 3019 Highpoint Trail
Your Personal Tour Guide
Ask me questions while you tour the home.